Market forecast:
Market turns from its recent low of 3250.87, and closed
with gain on 2nd consecutive day but not able to sustain the higher
levels.
Today STI formed a candlestick pattern called “Three inside Up”, another name for the Confirmed Bullish Harami Pattern. The
third day is confirmation of the bullish trend reversal.
The first 2
days of this pattern is simply the Bullish Harami Pattern, and the third day
confirms the reversal suggested by the Bullish Harami Pattern, since it is a
white candlestick closing with a new high for the last three days. The
reliability of this pattern is very high.
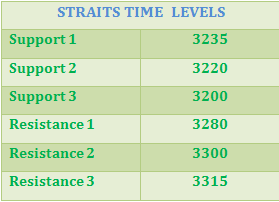
Now for coming days 3250 will act as a major support
zone because if STI break this level then it will be more bearish and can touch
3220-3190 levels soon.
Support:
STI
having immediate support @ 3260 level and below this level it can take support
@3240-3220 will be the support zone for STI.
Resistance:
STI
having immediate Resistance @3285 and above this level it may take resistance @
3300-3315 levels.
Technical indicators:
Technical
indicators MACD, RSI and CCI all are in bearish mode. As we can see in the
chart, RSI trading above its centreline @ 51.878 and CCI recovers some points
from -119.93 today closed @ -70.947

 9:04 PM
 Admin
Admin


