*Free SGX Stock Picks* Special Offer!
Showing posts with label live share tips. Show all posts

Tuesday, April 22, 2014

STI & KLCI Technical Report for 23rd April

Market Review for STI:
Today STI Opened at 3258.56 and came in a bullish trend after a consolidate move for last three days, it made a high of 3277.53 and closed at the same. It formed a green candle for the day.
STI Day Performance Open 3258.56
High 3277.53 % Change 0.67% Close 3277.53
Low 3255.64 Volume 2063.7M Fall 122
Change(Points) 21.70 Rise 296 Unch 654
Market forecast for STI:
A Green candle with a long real body was formed for the day with a short shadow. After three days of range bound trading today STI made a long candle for the day & take a bullish move. Marubozu pattern was formed for the day. Today STI break the high of 24th July 2013 a high point from last 11 Months, expected to take an up move for the coming sessions.
STRAITS TIME LEVELS
Support 1 3267
Support 2 3255
Support 3 3240
Resistance 1 3288
Resistance 2 3307
Resistance 3 3320
Technical indicators:
RSI is above the centre line @75.36 is about to move in overbought level. Where CCI is @ 149.49.
Important Factor for today:-
  • Mapletree Logistics Trust posted 1.89 Sg Cents for its Q4DPU
  • Ascendas Reit posted 3.5 Sg Cents for its Q4 DPU where the distributable income was 85.3 Million
  • Gerard Ee elected as a President of Institute of Singapore Chartered Accountants.
Market Review for KLCI:
A short green candle was formed for the day where KLCI opened at 1862.90 and made a high of 1866.42 and gave the same closing with a low of 1816.90
KLCI Day Performance Open 1862.90
High 1866.42 % Change 0.19% Close 1866.42
Low 1861.90 Volume 2609 M Fall 404
Change(Points) 3.49 Rise 455 Unch 1289
Market forecast for KLCI:
 After taking a long up move yesterday KLCI maintain itself above the support level of 1850 and now is in an uptrend as a green candle with a little lower shadow was formed for the day. By observing the last three trading session KLCI is now in an uptrend and buyers are more interested now.
Technical indicators:
RSI is above the centre line @64.26 else CCI is @175.54

Thursday, March 27, 2014

GOLD | SILVER | COPPER | CRUDE Technical Analysis

GOLD
Gold edged slightly higher overnight to open at 1313.50/1314.50, which was also the intraday high. Following the open it dipped to a low of 1300.25/1301.25 as the dollar strengthened and equities gained momentum following better-than-expected U.S. economic data that showed an increase in sales of durable goods. The slide in gold prices was also attributed to easing of tensions between Russia and the West, which suppressed demand for safe haven assets. The metal closed the day at 1302.50/1303.50.
GOld Chart Gold traded lower today, closing at 1302 and coming dangerously close to the 200-day moving average at 1296. A close below that level would be our stop-loss on our long-term bullish gold view. Resistance is at 1316/17, the high of the past two sessions.
Gold fell as encouraging U.S. manufacturing data reduced bullion’s appeal to institutional investors as a hedge against economic uncertainty
U.S. Federal Janet Yellen suggested interest rates could rise in the first half of 2015, raised the opportunity cost of holding non-yielding bullion.
SPDR gold trust holding dropped by 1.80 tonnes i.e. 0.22% to 816.97 tonnes from 818.77 tonnes.
SILVER
Silver was mostly unchanged overnight, opening at 19.97/20.02. It briefly climbed to a high of 20.01/20.06 before retreating on the back of gold to a low of 19.73/19.78, prior to concluding the session below the $20 mark at 19.76/19.81.
Silver had a bearish close today, closing lower at 19.76. We are bearish silver, looking for a test of the base of the consolidation that has been in place since early December, around the 18.83 low.
Silver Chart The gold-silver ratio is trading higher today at 65.90. There is support at 65.02, the 76.4% retracement of the last downtrend in the ratio from 67.47 high to 57.09 low. Uptrend support comes in at 62.99. We are bullish the ratio, targeting a test of the double top in the 67.50 area.
Silver prices dropped after official data showed that U.S. orders for long lasting manufactured goods came in higher-than-forecast in February.
Prices has been under heavy selling pressure amid growing expectations that the Federal Reserve will raise interest rates sooner than expected.
The Commerce Department reported that U.S. durable goods orders rose 2.2% last month, snapping two months of declines and surpassing expectations for a 1% increase.
COPPER
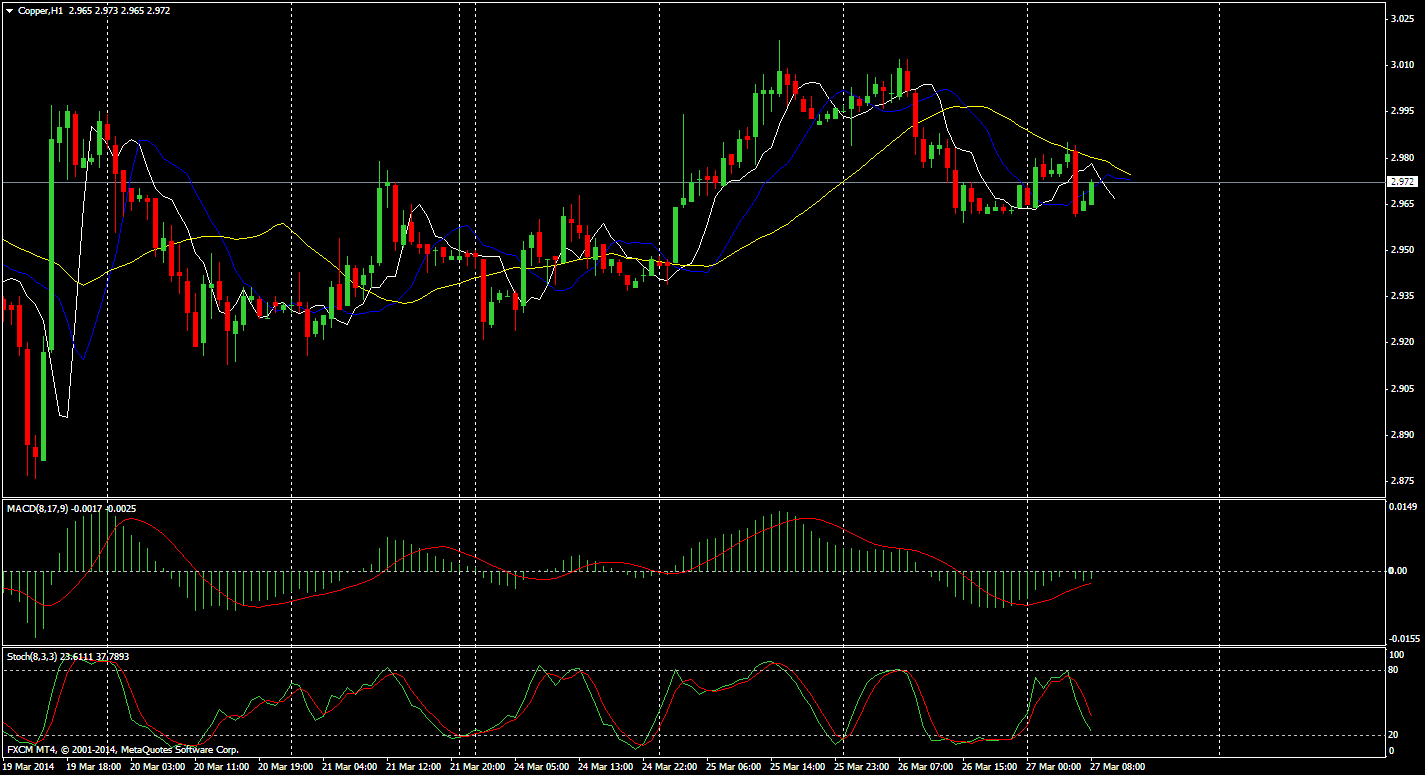
On the Comex division of the New York Mercantile Exchange, copper futures for May delivery fell to a session low of $2.982 a pound, before trimming losses to last trade at $2.985 during European morning hours, down 0.68%, or 2.0 cents.
Copper rallied to $3.045 a pound on Tuesday, the most since March 11, before settling at $3.005 a pound, up 2.04%, or 6.0 cents.
Futures were likely to find support at $2.939 a pound, the low from March 25 and resistance at $3.045 a pound, the high from March 25.
Copper Chart The U.S. is to release data on durable goods orders later in the session.
Data on Tuesday showed that U.S. consumer confidence improved more than expected in March. However, a separate report said that new home sales fell by the most in five months in February, indicating continued weakness in the housing sector.
Copper rallied on Tuesday amid growing hopes that China will unveil fresh stimulus measures to boost slowing economic growth.
Data released on Monday showed that Chinese manufacturing activity deteriorated for a third successive month in March.
The industrial metal fell to $2.877 a pound on March 19, the lowest since July 2010, amid growing concerns over the health of China’s economy.
Copper prices fell from the previous session’s two-week high on Wednesday, as investors looked ahead to key U.S. economic data later in the day for further indications on the strength of the economy and the future course of monetary policy.
CRUDE
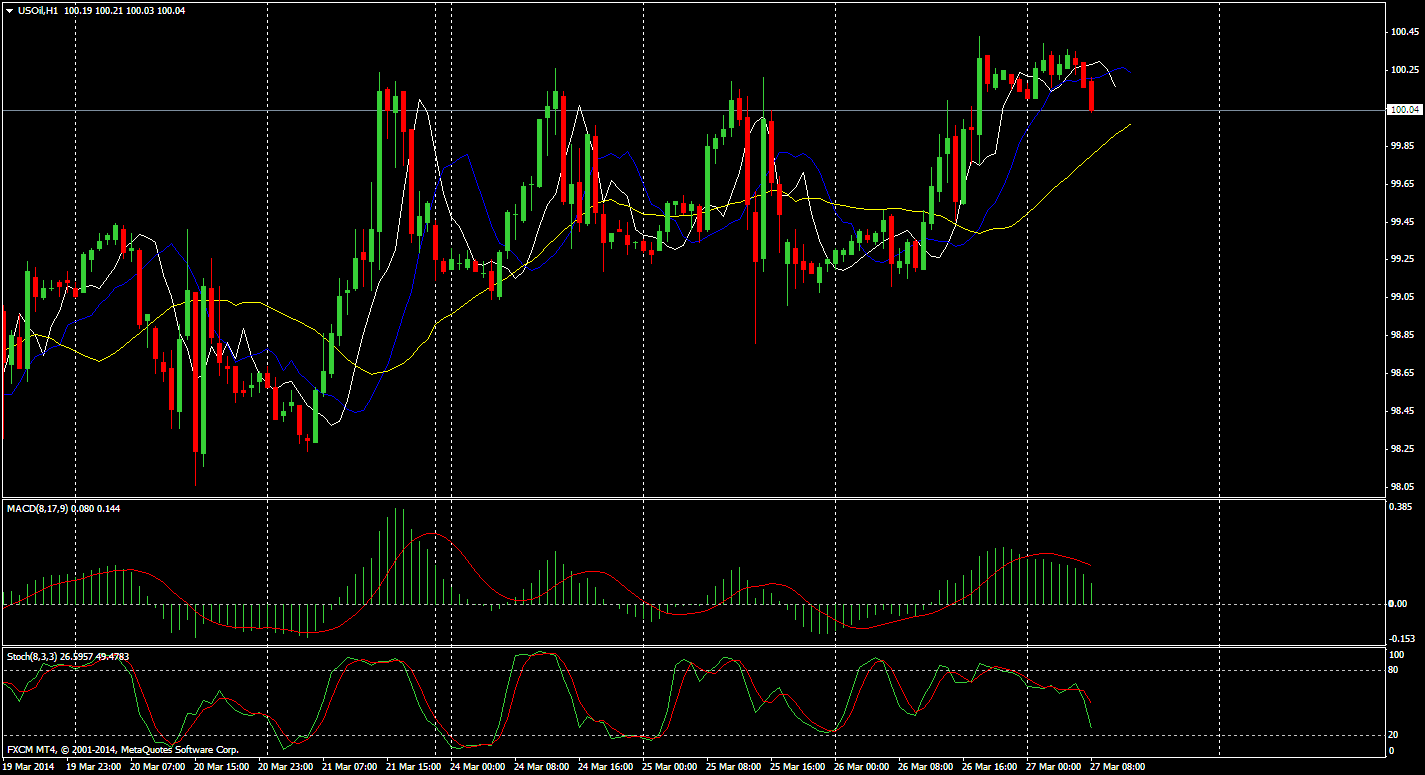
On the New York Mercantile Exchange, West Texas Intermediate crude oil for delivery in May traded at $100.32 a barrel, up 0.05%, after hitting an overnight session low of $99.11 a barrel and a high of $100.13 a barrel.
Prices for the global Brent oil futures contract rose four cents to settle at $107.03 a barrel on the ICE Futures Europe exchange on Wednesday.
Crude Chart Overnight, oil prices firmed after the Commerce Department reported that U.S. durable goods orders rose 2.2% in February, wiping out two months of declines and surpassing expectations for a 1.0% increase.
Core durable goods orders, which exclude transportation items, inched up 0.2%, slightly below forecasts for a 0.3% gain.
The numbers fueled expectations for a more sustained pickup in the U.S. economy, which should hike demand for more fuel and energy.
Weekly inventory data gave oil prices a boost as well.
The U.S. Energy Information Administration said in its weekly report that U.S. crude oil inventories rose by 6.6 million barrels in the week ended March 21, above expectations for an increase of 2.8 million barrels.
The EIA also reported a 1.3 million barrel draw at a delivery point in Cushing, Oklahoma, which was larger expected and eclipsed the otherwise bearish 6.6 million-barrel build.
Total U.S. crude oil inventories stood at 382.5 million barrels as of last week.
Crude oil prices edged slightly higher in Asia on Thursday from a morning drop that followed overnight gains on better-than-expected reports on U.S. durable goods and oil inventories.
Technical Levels
SUPPORT 1 SUPPORT 2 RESISTANCE 1 RESISTANCE 2
GOLD 1296 1288 1314 1324
SILVER 19.67 19.59 20.08 20.16
COPPER 2.9930 2.9755 3.0380 3.0830
CRUDE 99.42 98.58 100.78 101.30
Global Economic Data
TIME :IST DATA PRV EXP IMPACT
6.00P.M Unemployment Claims 320k 326k STRONG
6.00P.M FOMC Member Pianalto Speaks — — MEDIUM
6.00P.M Final GDP q/q 2.4% 2.7% MEDIUM
7.30P.M Pending Home Sales m/m 0.1% 0.1% STRONG
Unemployment Claims
Source Department of Labor (latest release)
Measures The number of individuals who filed for unemployment insurance for the first time during the past week;
Usual Effect Actual < Forecast = Good for currency;
Frequency Released weekly, 5 days after the week ends;
Next Release Apr 3, 2014
FF Notes This is the nation’s earliest economic data. The market impact fluctuates from week to week – there tends to be more focus on the release when traders need to diagnose recent developments, or when the reading is at extremes;
Why Traders
Care
Although it’s generally viewed as a lagging indicator, the number of unemployed people is an important signal of overall economic health because consumer spending is highly correlated with labor-market conditions. Unemployment is also a major consideration for those steering the country’s monetary policy;
Also Called Jobless Claims, Initial Claims;
Final GDP q/q
Source Bureau of Economic Analysis (latest release)
Measures Annualized change in the inflation-adjusted value of all goods and services produced by the economy;
Usual Effect Actual > Forecast = Good for currency;
Frequency Released quarterly, about 90 days after the quarter ends;
Next Release Jun 25, 2014
FF Notes While this is q/q data, it’s reported in an annualized format (quarterly change x4). The ‘Previous’ listed is the ‘Actual’ from the Preliminary release and therefore the ‘History’ data will appear unconnected. There are 3 versions of GDP released a month apart – Advance, Preliminary, and Final. The Advance release is the earliest and thus tends to have the most impact;
Why Traders
Care
It’s the broadest measure of economic activity and the primary gauge of the economy’s health;
Pending Home Sales m/m
Source National Association of Realtors (latest release)
Measures Change in the number of homes under contract to be sold but still awaiting the closing transaction, excluding new construction;
Usual Effect Actual > Forecast = Good for currency;
Frequency Released monthly, about 28 days after the month ends;
Next Release Apr 28, 2014
FF Notes This data is released about a week later than Existing Home Sales, but it’s more forward-looking as a contract is signed several weeks before the home is counted as sold;
Why Traders
Care
It’s a leading indicator of economic health because the sale of a home triggers a wide-reaching ripple effect. For example, renovations are done by the new owners, a mortgage is sold by the financing bank, and brokers are paid to execute the transaction;
Also Called Pending Resales;
Source National Association of Realtors (latest release)

Monday, March 24, 2014

COMEX Technical Analysis Report

GOLD
Gold climbed higher overnight to open at 1338.00/1339.00. It moved up marginally to a high of 1339.25/1340.25 as the Euro appreciated against the Dollar. The metal then declined to a low of 1333.00/1334.00 as global equities rebounded with the S&P setting a new intra-day high. It traded within range for most of the day to close at 1335.00/1336.00.
Gold had a bearish outside week, closing lower at 1335 and completely retracing last week’s gains. This is a potential reversal warning. The support level to watch is 1312, the 38.2% retracement of the 2014 uptrend. We have been bullish, but would revisit our view should 1312 be broken to the downside. Resistance is at the weekly high of 1392. Gold recovered its losses to settle flat as the dollar edged lower, though the market posted weekly drop following the Fed’s latest meet. An escalation of U.S. sanctions against Russia over the crisis in Crimea kept investors cautious, giving support to gold. SPDR gold trust holding gained by 4.19 tonnes i.e. 0.52% to 816.97 tonnes from 812.78 tonnes.
 SILVER
Silver was relatively unchanged overnight, opening at 20.41/20.46. It rose to a high of 20.45/20.50 before following gold lower to close at the session low of 20.28/20.33.
Silver had a bearish week, closing at 20.28. The metal continues to trade under the downtrend that has been in place since April 2011. Support is at the base of the consolidation that has been in place since June 2013, at the 18.20 level. We are neutral while silver continues to trade within this consolidation range. The gold-silver ratio is trading higher this week at 65.79. It is well supported from the uptrend, which currently comes in at 61.89. Resistance is at the double top in the 67.47 to 67.56 area. Silver remained under pressure as the dollar firmed after the U.S. Federal Reserve hinted at an interest rate hike in the first half of 2015. The central bank said that it would reduce its monthly bond buying program by an additional $10 billion to a total of $55 billion a month. The Fed also updated its forward guidance, discarding the 6.5% unemployment threshold for considering when to increase borrowing costs.
 COPPER
On the week, Comex copper prices ended down 0.02%, as ongoing concerns over the health of China’s economy dampened demand for growth-linked assets.
  Attention now shifts to the release of HSBC’s March China Purchasing Managers’ Index for manufacturing, due Monday. The Asian nation is the world’s largest copper consumer, accounting for almost 40% of world consumption last year. According to the CFTC, net copper shorts totaled 21,965 contracts as of last week, up 24.5% from net shorts of 10,473 in the preceding week. Copper settled flat due to the weak outlook toward Chinese growth and lack of key market movers China’s copper market will see a surplus of 400,000 tons in 2014 through a rise in copper production as imports surpass growth. A stronger RMB which eased concerns over China’s copper demand was also behind the higher copper prices.
 CRUDE
The HSBC data for March showed a drop to 48.1, compared to a forecast of 48.7 expected and to a final of 48.5 for the previous month. A figure below 50 implies contraction with the the latest number part of a string of disappointing China data suggesting a deepening economic slowdown at the start of 2014. “The HSBC Flash China Manufacturing PMI reading for March suggests that China’s growth momentum continued to slow down. Weakness is broadly based with domestic demand softening further,” said HSBC chief China economist Qu Hongbin.
“We expect Beijing to launch a series of policy measures to stabilize growth. Likely options include lowering entry barriers for private investment, targeted spending on subways, air cleaning and public housing, and guiding lending rates lower.” On the New York Mercantile Exchange, light sweet crude futures for delivery in May traded at $99.20 a barrel Crude Oil, down 0.26%. Crude oil settled 0.57% higher, or 56 cents, at $99.46 a barrel, last week on speculation over the fallout from the Ukraine crisis and amid indications the U.S. economy is improving. Investors continued to monitor events in the Ukraine, where tension over moves by neighboring Russia in the Crimean region have underpinned prices. The political standoff between the West and Russia following the annexation of Crimea escalated after the U.S. imposed harsher sanctions on Moscow. The European Union also agreed to wider sanctions against Russia. Crude oil prices stayed weaker in Asia on Monday after the China HSBC Flash Purchasing Managers Index for March unexpectedly fell, placing demand doubts in the market about the world’s second largest crude oil importer. 
Technical Levels

SUPPORT 1
SUPPORT 2
RESISTANCE 1
RESISTANCE 2
GOLD 1320
1313
1343
1350
SILVER 20.14
20.00
20.42
20.64
COPPER
2.9696
2.9186
3.0206
3.0473
CRUDE
98.39
97.32
100.39
101.32
Global Economic Data
TIME :IST DATA PRV EXP IMPACT
7.15P.M Flash Manufacturing PMI 57.1 56.6 MEDIUM
Flash Manufacturing PMI
Source Markit(latest release)
Measures Level of a diffusion index based on surveyed purchasing managers in the manufacturing industry;
Usual Effect Actual > Forecast = Good for currency;
Frequency Released monthly, around 3 weeks into the current month;
Next Release Apr 24, 2014
FF Notes Data is given to Thomson Reuters subscribers 2 minutes before the public release time listed on the calendar – early market reaction is usually a result of trades made by these subscribers. Above 50.0 indicates industry expansion, below indicates contraction. The ‘Previous’ listed is the ‘Actual’ from the Flash release and therefore the ‘History’ data will appear unconnected. There are 2 versions of this report released about a week apart – Flash and Final. The Flash release is the earliest and thus tends to have the most impact. Source first released in May 2012;
Why Traders
Care
It’s a leading indicator of economic health – businesses react quickly to market conditions, and their purchasing managers hold perhaps the most current and relevant insight into the company’s view of the economy;
Derived Via Survey of about 600 purchasing managers which asks respondents to rate the relative level of business conditions including employment, production, new orders, prices, supplier deliveries, and inventories;
Acro Expand Purchasing Managers’ Index (PMI);

Tuesday, March 18, 2014

COMEX Daily Technical Analysis Report

GOLD
Gold spiked overnight as investors awaited news on possible sanctions against Russia after Crimea voted to leave the Ukraine. The move however was short lived and the metal quickly retreated to open virtually unchanged at 1377.50/1378.50. Sideways trade throughout the day until selling interest emerged as the dollar started to recovered, taking the metal to a low of 1369.25/1370.25 prior to concluding the session at 1372.00/1373.00.
Gold had a bearish day today, making a new intraday high but then closing lower at 1372; a potential reversal warning. RSI is showing bearish divergence, having failed to make a new high on the new price high. While the longer-term uptrend still looks healthy, gold may face a test of the uptrend support which currently comes in at 1339. There should also be support from the top of the previous range, at 1355. Resistance is at the intraday high in the 1383 area.
Gold prices fell as a sharp rally in U.S. equities triggered profit-taking after bullion briefly rose in last some sessions.
Investors’ appetite for risk diminished in view of increasing political tensions and economic troubles, which benefit gold.
SPDR gold trust holding dropped by 3.81 tonnes i.e. 0.47% to 812.78 tonnes from 816.59 tonnes.
SILVER
Silver moved higher and later retreated alongside gold overnight to open at 21.23/21.28. It quickly touched a low of 21.20/21.25 before proceeding to an intraday high of 21.40/21.45. The metal concluded the session at 21.24/21.29.
Silver closed lower today at 21.24. The metal has struggled to break out of its sideways range. Support is at the recent low of 20.61, with resistance at Friday’s high of 21.79. We remain neutral. 
Silver dropped tracking weak gold prices after Crimea voted to join Russia and leave Ukraine on Sunday with no widespread violence
Fed will most likely to announce another $10 billion cut to its bond-buying stimulus after solid U.S. retail sales and employment data
Investors remained cautious after Russia launched new military exercises near its border with Ukraine, showing no sign of backing down on plans to annex Crimea.
COPPER
On the Comex division of the New York Mercantile Exchange, copper futures for May delivery fell to a session low of $2.922 a pound, before trimming losses to last trade at $2.946 a pound during European morning hours, down 0.15%, or $0.004 cents.The May copper contract rose 0.94%, or 0.275 cents to settle at $2.950 a pound on Friday.Futures were likely to find support at $2.912 a pound, the low from March 14 and resistance at $2.977 a pound, the high from March 13.
Results showed that nearly 97% of voters in Crimea chose to break away from Ukraine and join Russia in a referendum deemed illegal by the European Union and the U.S.
Russia's lower house of parliament has stated that it will pass legislation allowing Crimea to join the nation in the "very near future."
U.S. President Barack Obama said Washington rejected the results of the referendum and warned that the U.S. was ready to impose sanctions on Moscow.
Western countries have threatened to ratchet up sanctions against Russia if it does not back down on annexing Crimea.
Copper has been under heavy selling pressure in recent sessions as growing concerns over the health of China’s economy dampened demand for growth-linked assets.
The industrial metal fell to $2.908 a pound on March 12, the lowest since July 2010.
The Asian nation is the world’s largest copper consumer, accounting for almost 40% of world consumption last year.
Elsewhere on the Comex, gold for April delivery was flat to trade at $1,378.90 a troy ounce, while silver for May delivery shed 0.15% to trade at $21.38 an ounce.
Market players looked ahead to key U.S. economic data later in the day for further indications on the strength of the economy and the future course of monetary policy.
The U.S. is to publish data on manufacturing activity in the Empire State, as well as reports on industrial production and long term securities transactions.
Copper prices edged lower on Monday, as concerns escalated over Ukraine after results of Sunday's referendum showed voters in Crimea voting to join Russia..
CRUDE
On the New York Mercantile Exchange, West Texas Intermediate crude for delivery in May traded at $97.56 a barrel, down 0.07%, after hitting an overnight session low of $97.01 a barrel and a high of $98.91 a barrel.
Brent crude on the ICE futures exchange fell $1.97, or 1.8%, to $106.24 a barrel on Monday, its lowest settlement price since Feb. 4.
Investors continued to monitor events in Europe, after over 90% of Crimean voters on Sunday chose to break with Ukraine and join Russia. Crimea's Parliament on Monday formally asked to join the Russian Federation.
Sanctions followed as expected.
European Union foreign ministers imposed travel bans and asset freezes on 21 people they have linked to the push to have Crimea secede from Ukraine to be annexed by Russia. U.S. President Barack Obama also imposed sanctions on several Russian officials involved in the incursion of Crimea, which included freezing assets in the U.S.
Still, markets were expecting more widespread action from the West, and the response enticed investors away from oil by allaying fears the conflict could escalate and threaten energy supply from Russia.
Investors took hit-or-miss U.S. economic indicators in stride.
Data revealed earlier that U.S. industrial production rose 0.6% in February, exceeding expectations for a 0.1% gain. Industrial production in January was revised to a 0.2% fall from a previously estimated 0.3% decline.
Crude price were slightly weaker in Asian trade on Tuesday as relatively tame sanctions from the West on Russia, the world's top oil producer, over the annexation of the Crimean region of the Ukraine allayed concerns of any abrupt cutoff in supplies.
Technical Levels

SUPPORT 1 SUPPORT 2 RESISTANCE 1 RESISTANCE 2
GOLD 1368 1358 1388 1398
SILVER 21.13 20.89 21.64 21.91
COPPER 2.9865 2.9600 3.0300 3.0470
CRUDE 98.20 97.50 99.42 100.64
Global Economic Data
TIME :IST DATA PRV EXP IMPACT
6.00P.M Building Permits 0.94M 0.97M STRONG
6.00P.M Core CPI m/m 0.1% 0.1% STRONG
6.00P.M Housing Starts 0.88M 0.92M MEDIUM
6.30P.M TIC Long-Term Purchases -45.9B 23.4B MEDIUM
Building Permits
Source Census Bureau(latest release)
Measures Annualized number of new residential building permits issued during the previous month;
Usual Effect Actual > Forecast = Good for currency;
Frequency Released monthly, about 17 days after the month ends;
Next Release Apr 16, 2014
FF Notes While this is monthly data, it's reported in an annualized format (monthly figure x12);
Why Traders
Care
It's an excellent gauge of future construction activity because obtaining a permit is among the first steps in constructing a new building;
Also Called Residential Building Permits;
Source Census Bureau(latest release)
Core CPI m/m
Source Bureau of Labor Statistics (latest release)
Measures Change in the price of goods and services purchased by consumers, excluding food and energy;
Usual Effect Actual > Forecast = Good for currency;
Frequency Released monthly, about 16 days after the month ends;
Next Release Apr 15, 2014
FF Notes Food and energy prices account for about a quarter of CPI, but they tend to be very volatile and distort the underlying trend. The FOMC usually pays the most attention to the Core data - so do traders;
Why Traders
Care
Consumer prices account for a majority of overall inflation. Inflation is important to currency valuation because rising prices lead the central bank to raise interest rates out of respect for their inflation containment mandate;
Also Called CPI Ex Food and Energy, Underlying CPI;
Acro Expand Consumer Price Index (CPI), Federal Open Market Committee (FOMC);
Housing Starts
Source Census Bureau(latest release)
Measures Annualized number of new residential buildings that began construction during the previous month;
Usual Effect Actual > Forecast = Good for currency;
Frequency Released monthly, about 17 days after the month ends;
Next Release Apr 16, 2014
FF Notes While this is monthly data, it's reported in an annualized format (monthly figure x12). This data is slightly overshadowed by Building Permits because they are tightly correlated and a permit must be issued before a house can begin construction;
Why Traders
Care
It's a leading indicator of economic health because building construction produces a wide-reaching ripple effect. For example, jobs are created for the construction workers, subcontractors and inspectors are hired, and various construction services are purchased by the builder;

Wednesday, March 5, 2014

STI Daily Technical Analysis Report

Market Review:
Today as the third trading session of the week the market still maintain the uptrend and the investor also looks seems to be positive for this, which can be observed by the volume in the market.
STI opened high at 3113.15 around 7 points up and closed high at 3116.04, ending the session with a green candle.
STI Day Performance
Open
3078.29
High
3116.64
Low
3067.24
Close
3116.64
Change(Points)
-16.71
% Change
-0.539
Volume
2105.2
Rise
211
Fall
205
Unch
380
Market forecast:
STI recovers for 3rd straight day and traded above 3105 level, however the trading range was very low for the day it was only 8 points after gap up opening.
STI trading well above its 50 & 20 day EMA level of 3090 & 3083 level, it’s a positive sign for STI, 20 day EMA is continuously increasing and trading very near to its 50 day EMA . we can expect crossover of longer period from lower side by short period i.e 20 day EMA, can cross 50 Day EMA from lower side which is positive sign for Index , if it will happen then we can see more bullishness in Index.
As we previously mention for coming days we see some turn around movements as the 4Q13 earnings season is heading towards the end, and investors’ attention to key economic events in the US such as Unemployment Rate and Non-farm Payroll.
Support level: STI having immediate support @ 3095 level and below this level it can take support @3080-3065 will be the support zone for STI.
Resistance: STI having immediate Resistance @3120 and above this level it may take resistance @ 3135-3150
STRAITS TIME LEVELS
Support 1
3095
Support 2
3080
Support 3
3065
Resistance 1
3120
Resistance 2
3135
Resistance 3
3150
Technical indicators: With the recovery now Technical indicators MACD trading in bullish zone in Daily chart , RSI crossed its centreline zone and trading above 50 @ 59.9 and CCI @ 90.999
Important Factor for today:-
  • Securities were trading down by 7% in Feb Where as STI said today that the security trading fell by 35% to S$20.9Billion. Daily average value of trading fell 41% to S$1Billion as more trading session in Feb2013.
  • Loyz Energy to buy 20% of Norwegian oil and gas firm
  • Today Ezara Holding is awarded subsea construction and offshore support contracts and options in Asia Pacific and West Africa worth over US$125 million.
  • Amtek buys US firm in S$267M deal.
Top 5 Gainers
Top 5 Loosers
Scrip Name
CMP
%change
Scrip Name
CMP
%change
JMH 400US
60.000
3.448
UOB
20.530
-1.203
JSH 500US
34.660
3.155
DairyFarm 900
9.020
-1.313
Jardine C&C
40.000
2.564
DBS
16.210
-0.735
OSIM
2.510
4.583
Shang Asia
12.880
-0.923
SIA
10.240
0.887
GreatEast
17.980
-0.333

Monday, March 5, 2012

Singapore Stock Market(STI) daily Report

Singapore Stock Report
Singapore stocks kicked off the week on a cautious note after US shares closed weaker on Friday. Straits Times Index added 2.77 points or 0.12 per cent to 2,996.26.

Singapore shares opens near to day high of 2996.26 and then it comes down and made a low of 2983.19 and then recovers some points and consolidate in 15 points and finally closed @ 2991.80 with loss of 1.69
points down by 0.06%.Volume was 1.41 billion shares worth $918.60 million. Losers led gainers 275 to 142.

Singapore Exchange on Monday said derivative volumes and activity in the securities and commodity market grew in February. Securities daily average value rose 41 % month on month to $1.8 billion in February,
representing a 4 % growth from a year ago.

STI for Tomorrow
STI tries to cross itself above the 3000 mark, but cant able to cross its day  high of 2998.12 and closed below this level.

It was a very low movement in today’s trade, STI traded in the range of 15 points. it was consolidating in the 2985-2992 and finally closed @ 2991.80 with loss of 1.69 points. For the coming days, investors have to follow a cautious approach in  markets as market was at high levels so some profit taking is possible from
higher levels.

STI Support
STI having nearest support @ 2975 and below this level it can take support @ 2945 levels and 2920 is the major support level.

STI Resistance
STI having Resistance @ 3015 and above this level it may take resistance from 3035-3050 levels.

Technical
Technical indicator MACD, stochastic and RSI not giving any clear indication.

Fill the Form & Get All Stock Picks, Live Forex signals, Share Prices. or Click Here

 
Design by Free WordPress Themes | Bloggerized by Lasantha - Premium Blogger Themes | Grants For Single Moms