*Free SGX Stock Picks* Special Offer!
Showing posts with label daily singapore market news. Show all posts

Monday, June 23, 2014

STI & KLCI Daytrading Forecast

Market Review for STI:
Consumer price inflation in Singapore picked up a little more than expected to 2.7% in May as Asian stocks supported demand and opened higher. This put an effect on SGX scrip prices which opened higher with STI up 3.37 points to 3262.17 making a high at 3265.08 with low of 3254.26. A 3257.40level is marked as today’s low.
STI Day Performance
Open 3262.17
High 3265.08
Low 3254.26
Close 3257.40
Change(Points) -1.400
% Change -0.04%
Volume 18337.4M
Rise 747
Fall 175
Unch 238
Market forecast for STI:
Market is continuously moving down by forming rounding top pattern having red candlesticks and today it stood at 3257.40 levels, which acted as a major support for the prices. If this level is broken then prices will fall down to the level of 3180.
Technical indicators:
RSI stood below the centre line at 42.296 with its CCI at-170.43. Difference line of MACD performed at 1.804 which lied below its signal line which performed at 8.114.
STI LEVELS
Support 1 3244
Support 2 3234
Support 3 3219
Resistance 1 3275
Resistance 2 3285
Resistance 3 3300
Important Factor for today:-
  • Oil prices edged higher on escalating violence in Iraq, WTI gained 31 cents to US$107.14.
  • Singapore’s Real Estate group Frasers centre point Ltd (FCL) stated to raise S$365 million (US$292 million) by listing its real estate investment trust in Singapore.
  • Singapore’s agency for Science, Technology and Research (ASTAR) and New Zealand’s Ministry of Business, Innovation and Employment (MBIE) reported to jointly invest S$3.8 million for two years to boost food and nutrition research.
Top Gainers Top Losers
Scrip Name CMP %change Scrip Name CMP %change
Olam Intl 2.45 3.81 JMH 400 USD 60.18 -1.34
HongkongLand USD 6.65 0.76 CityDev 10.24 -1.06
Sembcorp Marine 4.05 0.5 Golden Agri-Res 0.56 -0.89
SPH 4.2 0.48 Sembcorp Ind 5.38 -0.74
Ascendas Reit 2.29 0.44 StarHub 4.23 -0.7
Market Review for KLCI:
Malaysian economy is doing well as current debt service ratio continues to be moderate and sustainable at 10.7% and it is also heading into a safe zone. Ringgit also supported on an improved demand. On that account, Malaysian shares opened lower with FBMKLCI 0.98 points to 1884.74. Market didn’t go much high but it made a low of 1881.82 level and closed at 1883.96.
KLCI Day Performance
Open 1884.74
High 1885.33
Low 1881.82
Close 1883.96
Change(Points) -1.760
% Change -0.09%
Volume 1769.8M
Rise 373
Fall 430
Unch 1404
Market forecast for KLCI:
Share prices movement formed a rounded bottom pattern for the last week and today’s candlestick formed a hammer pattern in red market which shows a bearish reversal for the further movement.
KLCI LEVELS
Support 1 1871
Support 2 1861
Support 3 1846
Resistance 1 1895
Resistance 2 1905
Resistance 3 1920
Technical indicators:
RSI stood below the centre line at 59.335 with its CCI at 160.83. Difference line of MACD performed at 3.848 which lied above its signal line which performed at 2.802.
Top Gainers Top Losers
Scrip Name CMP %change Scrip Name CMP %change
ASTRO 3.48 2.96 YTL 1.55 -1.9
IOICORP 5.24 1.16 FGV 4.35 -1.81
HLFG 15.94 0.89 MISC 6.44 -1.38
RHBCAP 8.51 0.83 SKPETRO 4.42 -1.12
TM 6.29 0.8 GENM 4.24 -0.94

Tuesday, May 6, 2014

Singapore Stock Market Technical Analysis

Market Review for STI:
STI made a gap up at 3249.13 in the today’s session, a jump of almost 8 points was noticed at the time of opening. Later it came down and made a low of 3242.39 and closed near to low @ 3245.56.
STI Day Performance
Open
3249.13
High
3250.66
Low
3242.39
Close
3245.56
Change(Points)
3.96
% Change
0.12%
Volume
1242M
Rise
221
Fall
178
Unch
678
Market forecast for STI:
STI formed a red candle for the day. Today it was third continuous day for STI to form Red candle in a line. As it is standing on the major support of 3240. A little consolidation is expected in tomorrow’s session.
Technical indicators:
RSI is just above the centre line the centre line @56.62 Where CCI is @ 19.37
STI LEVELS
Support 1
3235
Support 2
3225
Support 3
3210
Resistance 1
3255
Resistance 2
3265
Resistance 3
3280
Important Factor for today:-
  • Purchasing Manager’s Index (PMI) for Singapore increased to 51.1 in April where in March it was 50.8 was in March.
  • Singapore Iron Ore Week starts from today to 8th May 2014.
  • Singapore Exchange announced that the total traded value of Securities fell from 17% to 25.8 Billion in April where the Commodity trading and the Clearing activity grew on YOY basis.
  • Q4 net Profit of SIAEC engineering fall to 1.1% to S$65.2 million.
  • Acquisition of 89.18% Stake was made in Natural Gas Business in China from China Print Power, valued to HK$ 515.4 Million.
  • Cash earning of S$15.3 million for Q4 ended 31 March 2014 published by CitySpring
Top Gainers
Top Loosers
Scrip Name
CMP
%change
Scrip Name
CMP
%change
Genting Sing
1.345
2.67
SPH
4.14
-1.43
ThaiBev
0.61
1.67
Golden Agri-Res
0.61
-0.81
CityDev
10.89
1.02
HongkongLand USD
6.76
-0.59
UOB
21.61
0.75
Jardine C&C
44.77
-0.4
HPH Trust USD
0.68
0.74
Global Logistic
2.78
-0.36
Market Review for KLCI:
KLCI opened flat today @1860.35 and made a high of 1864.23 where it closed at the same of opening point of 1860.43, low of the day was 1856.85
KLCI Day Performance
Open
1860.35
High
1864.23
Low
1856.85
Close
1860.43
Change(Points)
-0.11
% Change
-0.01
Volume
1467.4M
Rise
460
Fall
273
Unch
1428
Market forecast for KLCI:
A long green Doji candle was formed for the day with a very small body and a long upper and lower shadow for the day. we expect a little correction for tomorrow’s trading session.
KLCI LEVELS
Support 1
1850
Support 2
1840
Support 3
1825
Resistance 1
1870
Resistance 2
1880
Resistance 3
1895
Technical indicators:
RSI is just above the centre line @ 54.20 where the CCI is performing at 26.22
Top Gainers
Top Loosers
Scrip Name
CMP
%change
Scrip Name
CMP
%change
HLBANK
13.84
0.73
BAT
61.2
-1.29
MAXIS
6.97
0.72
ASTRO
3.27
-1.21
FGV
4.54
0.44
PETGAS
23.36
-0.68
SIME
9.48
0.42
PCHEM
6.76
-0.59
IOIPG
2.66
0.38
HLFG
15.02
-0.53

Friday, April 25, 2014

Singapore & Malaysia Stock Market Weekly Review

Weekly Technical view on STI
Weekly wrap of STI:
This was the good week for STI & it made a Green candle for this week continuing the bullish trend of last week as there was a gap up opening of around 8 points in this week.
STI cover the range of 34 points for this week. A spinning top candle was formed for this week and with a short real body. As the whole week was full of Q1 result & dividend distributed by the counters so the bullish trend is expected in the coming week.
Support 1
Support 2
Support 3
Resistance 1
Resistance 2
Resistance 3
3250
3230
3200
3280
3300
3330
Macroeconomic factors:
  • Singapore consumer price or inflation rose by 1.2% in March, where food inflation rose by 2.9% & health care inflation by 3.4%
  • A fall of 22% reported in net profit of Singapore Exchange a net profit of S$ 75.8 million was reported
  • Gerard Ee elected as a President of Institute of Singapore Chartered Accountants.
  • CapitaMall Asia made a jump of 2.8% to S$75.3 million in Net Profit for 1Q 2014.
  • RH Perto Gas Investments proposed sale of 49% Stake in RHP for US $ 2.79Million
  • Shares in Catalist listed SHC Capital Asia surged on Monday that it is discussing a sale of its core insurance business
Market Forecast for week ahead:
The market is moving in the uptrend and is supported by the good volume the technical indicators are also positive for the next week. The expected range for the coming week of STI would be 3250- 3300.
In the coming week there will be many counters like MapleTree, ThaiBev,SGX, CapitaMalls Asia, OCBC Bank and many more which will be delivering there dividend so the fundamental will be supportive for the up move of STI.
STRAIT TIMES WEEKLY WRAP
OPEN
3260.78
HIGH
3284.70
LOW
3250.09
CLOSE
3267.57
CHANGE (In Points)
13.77
% CHANGE
0.42 %
Technical Indicators:
Technical Indicators are showing the uptrend where RSI is above the centre line @52.27 else CCI is @ 181.57 which means that there is still a fair move for STI to take upside.
Weekly Technical view on KLCI
Weekly wrap of KLCI:
KLCI opened at 1851.61 for this week, took the uptrend and made a high of 1870.89 and closed at 1860.98 for this week. A green candle was formed for this week. For this week KLCI make a movement of almost 20 points.
A Inverted hammer Pattern was formed for this week with a long real body and a long upper shadow. 20 Days EMA is @1830 where the 50 Days EMA is @ 1792.
Support 1
Support 2
Support 3
Resistance 1
Resistance 2
Resistance 3
1845
1825
1800
1875
1890
1915
Market Forecast for week ahead:
KLCI is performing at its peak and is able to sustain itself form last three week so it can be said that now it is above the crucial level and expected to break the resistance.
Technical Indicators:
Technically KLCI is having a bullish trend on the chart where CCI is @121.03 & RSI is about to enter in the overbought range @62.83
KLCI WEEKLY WRAP
OPEN
1851.61
HIGH
1870.89
LOW
1849.68
CLOSE
1860.98
CHANGE (In Points)
8.29
% CHANGE
0.44 %

Tuesday, April 22, 2014

STI & KLCI Technical Report for 23rd April

Market Review for STI:
Today STI Opened at 3258.56 and came in a bullish trend after a consolidate move for last three days, it made a high of 3277.53 and closed at the same. It formed a green candle for the day.
STI Day Performance Open 3258.56
High 3277.53 % Change 0.67% Close 3277.53
Low 3255.64 Volume 2063.7M Fall 122
Change(Points) 21.70 Rise 296 Unch 654
Market forecast for STI:
A Green candle with a long real body was formed for the day with a short shadow. After three days of range bound trading today STI made a long candle for the day & take a bullish move. Marubozu pattern was formed for the day. Today STI break the high of 24th July 2013 a high point from last 11 Months, expected to take an up move for the coming sessions.
STRAITS TIME LEVELS
Support 1 3267
Support 2 3255
Support 3 3240
Resistance 1 3288
Resistance 2 3307
Resistance 3 3320
Technical indicators:
RSI is above the centre line @75.36 is about to move in overbought level. Where CCI is @ 149.49.
Important Factor for today:-
  • Mapletree Logistics Trust posted 1.89 Sg Cents for its Q4DPU
  • Ascendas Reit posted 3.5 Sg Cents for its Q4 DPU where the distributable income was 85.3 Million
  • Gerard Ee elected as a President of Institute of Singapore Chartered Accountants.
Market Review for KLCI:
A short green candle was formed for the day where KLCI opened at 1862.90 and made a high of 1866.42 and gave the same closing with a low of 1816.90
KLCI Day Performance Open 1862.90
High 1866.42 % Change 0.19% Close 1866.42
Low 1861.90 Volume 2609 M Fall 404
Change(Points) 3.49 Rise 455 Unch 1289
Market forecast for KLCI:
 After taking a long up move yesterday KLCI maintain itself above the support level of 1850 and now is in an uptrend as a green candle with a little lower shadow was formed for the day. By observing the last three trading session KLCI is now in an uptrend and buyers are more interested now.
Technical indicators:
RSI is above the centre line @64.26 else CCI is @175.54

Monday, April 21, 2014

Singapore & Malaysia Stock market Analysis for 22nd April

Market Review for STI:
Today STI opened at 3260.78 and made a high of 3264.21 later pressure was seen in the market and it made a low of 3250.91 while closed at 3255.83. There was the volume of 1706.5Million.
STI Day Performance
Open3260.78
High3264.21
Low3250.91
Close3255.83
Change(Points)2.03
% Change0.06%
Volume1706.5M
Rise176
Fall217
Unch679
Market forecast for STI:
A Red candle was formed for the day a Spinning Top candle was formed with a short real body and short upper and lower shadow. As published in our weekly report; that STI would take some corrections, today it formed a red candle for the day and is expected to be in same correction mode for few trading sessions.
Technical indicators:
RSI is above the centre line @72.09 is about to move in overbought level. Where CCI is @ 130.87.
STRAITS TIME LEVELS
Support 1
3245
Support 2
3230
Support 3
3215
Resistance 1
3265
Resistance 2
3280
Resistance 3
3295
Important Factor for today:-
  • CapitaMall Asia made a jump of 2.8% to S$75.3 million in Net Profit for 1Q 2014.
  • RH Perto Gas Investments proposed sale of 49% Stake in RHP for US $ 2.79Million
  • Shares in Catalist listed SHC Capital Asia surged on Monday that it is discussing a sale of its core insurance business.
  • Trading in Chemoil will be suspended from 5 May 2014 as Friday 2nd May will be the last trading for Chemoil. 
Market Review for KLCI:

Today KLCI opened at 1851.61 and took the up move, made a high of 1864.94 and gave closing near to its high at 1862.93 while at the time of opening KLCI opened down with a lower side of 1849.68.
KLCI Day Performance
Open1851.61
High1864.94
Low1849.68
Close1862.93
Change(Points)10.24
% Change0.55%
Volume2608.9M
Rise523
Fall326
Unch1299
Market forecast for KLCI:
A long green candle was formed for the day with a long real body and short upper and lower shadow. As KLCI has recovered from down side and now is in a complete uptrend and looks forward to break its resistance of 1872 in the coming trading days.
Technical indicators:
RSI is above the centre line @62.42 else CCI is @111.71
KLCI LEVELS

Support 1
1852
Support 2
1840
Support 3
1825
Resistance 1
1872
Resistance 2
1885
Resistance 3
1899

Friday, March 28, 2014

GOLD | SILVER | COPPER | CRUDE Commodity Technical Analysis

GOLD
Gold retreated overnight to open at 1292.50/1293.50. It climbed to a high of 1299.50/1300.5 on concerns of tougher sanctions on Russia by the West despite a decline in initial jobless claims in the U.S. The metal then declined to a six-week low of 1292.00/1293.00 on dollar strength and speculation that U.S. interest rates will rise sooner than expected. Thereafter, it consolidated to close the day at 1293.50/1294.50.
GOld Chart Gold ended the session at 1294, closing below the 200 day MA at 1296 as it approaches the 50% Fibo retracement level (1287.45) of the 2014 rally to mid-March. Subsequent downside levels include the 100 day MA at 1272 and the 61.8% Fibo retracement level at 1262.70. Resistance is expected at 1308 the March 24th close.
The Labor Department said the number of people who filed for initial jobless benefits in the U.S. last week declined by 10,000 to a seasonally adjusted 311,000 from the previous week’s revised total of 321,000. Analysts had expected jobless claims to rise by 4,000.
The upbeat data added to hopes that the slowdown in economic activity seen at the start of the year would be temporary.
Also Thursday, the National Association of Realtors said its pending home sales index dropped by a seasonally adjusted 0.8% last month, disappointing expectations for a 0.3% gain.
SILVER
Silver moved lower overnight to openSilver Chart at 19.64/19.69. After a brief high at 19.74/19.79, it declined to a low of 19.60/19.65, prior to concluding the session at 19.70/19.75.
Silver closed at 19.73. The bearish trend in silver remains intact as the decline approaches the December 31st low at 18.8266. There are no key support levels ahead of the December 31st low.
The gold silver ratio has formed an engulfing bearish reversal; closing at 65.56, below yesterday’s open despite initially trading on an upswing. The upward sloping resistance trend line from the December and February highs has held, highlighting a challenge to further gains. Looking to the downside, the next key levels of support would be expected at 64.50 and 63.80.
COPPER
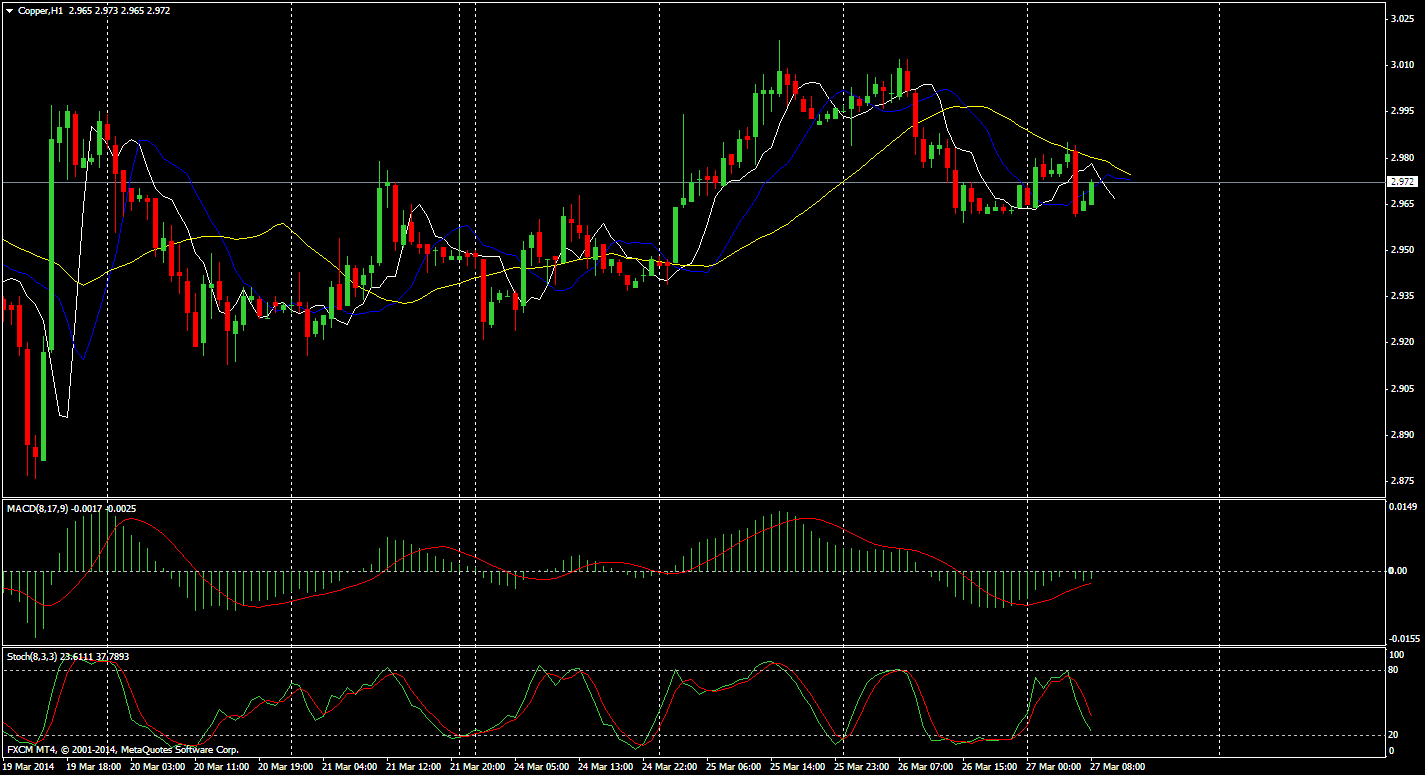
On the Comex division of the New York Mercantile Exchange, copper futures for May delivery rose to a session high of $2.986 a pound, before trimming gains to last trade at $2.978 during European morning hours, up 0.4%, or 1.2 cents.
Copper lost 1.33%, or 4.0 cents, on Wednesday to settle at $2.965 a pound.
copper crude
Futures were likely to find support at $2.939 a pound, the low from March 25 and resistance at $3.045 a pound, the high from March 25.
The U.S. is to publish final data on fourth quarter economic growth, as well as the weekly report on initial jobless claims and private sector data on pending home sales.
Upbeat U.S. durable goods orders figures on Wednesday indicated that economy is gaining momentum in the wake of a weather-induced slowdown.
Meanwhile, in China, data released earlier showed mainland China industrial profits increased 9.4% in the two months through February year-on-year, compared with 17% growth a year earlier.
The industrial metal fell to $2.877 a pound on March 19, the lowest since July 2010, amid growing concerns over the health of China’s economy.
The Asian nation is the world’s largest copper consumer, accounting for almost 40% of world consumption last year.
Copper prices regained strength on Thursday, as investors looked ahead to key U.S. economic data later in the day for further indications on the strength of the economy and the future course of monetary policy..
CRUDE
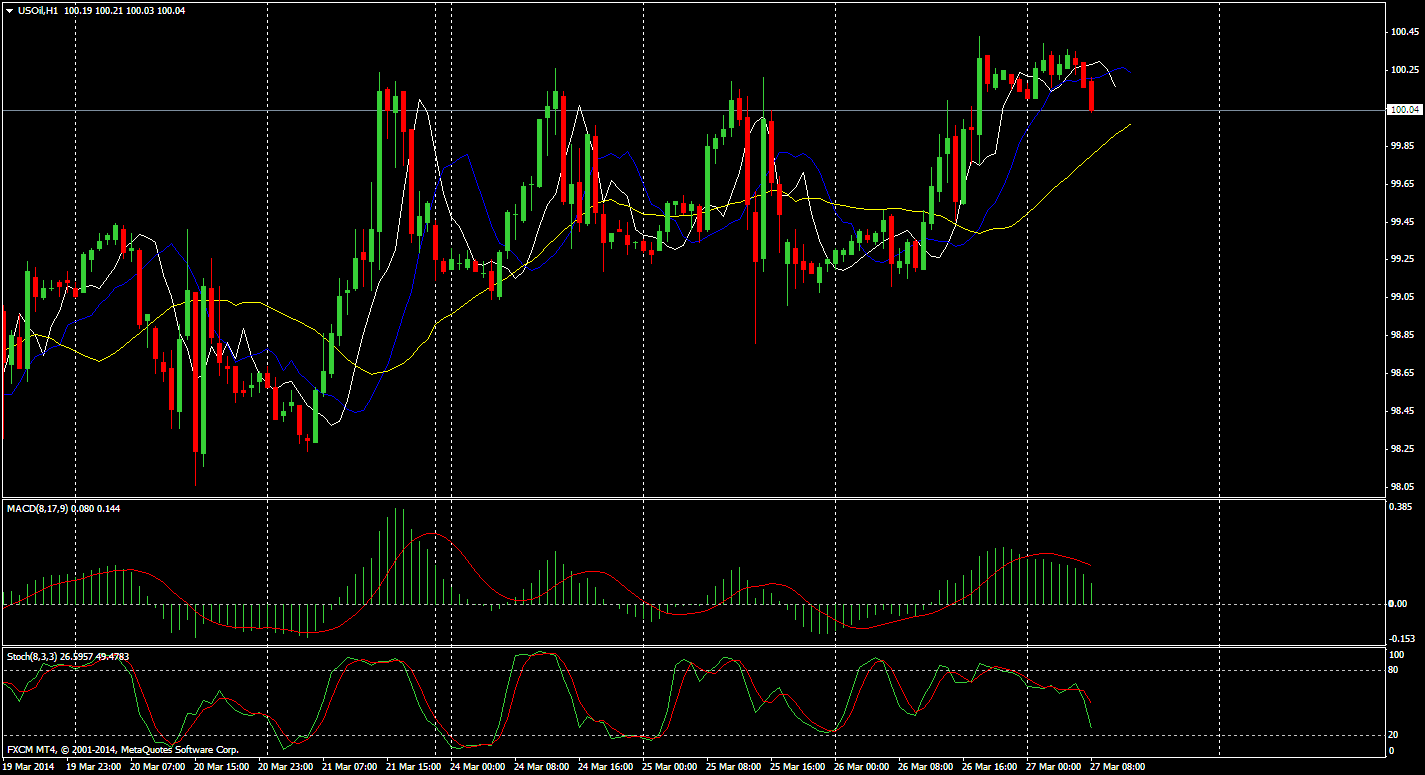
On the New York Mercantile Exchange, West Texas Intermediate crude oil for delivery in May traded at $101.35 a barrel, up 0.07%. On Thursday it reached the highest settlement price since March 7, after hitting an overnight session low of $100.04 a barrel and a high of $101.69 a barrel.
Crude Chart
Brent oil on the ICE futures exchange rose 80 cents, or 0.8%, to $107.83 a barrel on Thursday, its highest level since March 14.
Oil prices shot up after the Commerce Department reported earlier that U.S. gross domestic product was revised up to 2.6% in the final three months of 2013, up from a preliminary estimate of 2.4%. Market expectations had been for an upward revision to 2.7%.
Still, the report showed that personal spending was revised up to 3.3% from 2.6% initially, the fastest rate of growth in three years, which drew applause from investors betting that sluggish economic indicators hitting the wire earlier this year were the result of rough winter weather that disrupted commerce and not due to an economic soft patch.
Separately, the Labor Department said the number of individuals filing for initial jobless benefits in the U.S. last week declined by 10,000 to a 311,000 from the previous week’s revised total of 321,000.
Analysts were expecting jobless claims to rise by 4,000.
Also supporting both U.S. and European crude blends were concerns the U.S. and Europe may stiffen sanctions on crude-rich Russia and subsequently threaten global oil supply.
Crude oil prices gained slightly in Asia on Friday on a carryover from overnight better-than-expected U.S. economic growth and weekly jobless claims data.
Technical Levels
SUPPORT 1SUPPORT 2RESISTANCE 1RESISTANCE 2
GOLD1287127913051315
SILVER19.5219.3719.8420.01
COPPER3.01652.99653.04653.0565
CRUDE100.3099.33101.97102.67
Global Economic Data
TIME :ISTDATAPRVEXPIMPACT
6.00P.MCore PCE Price Index m/m0.1%0.1%MEDIUM
6.00P.MPersonal Spending m/m0.4%0.3%MEDIUM
7.25P.MRevised UoM Consumer Sentiment79.980.6MEDIUM
7.25P.MRevised UoM Inflation Expectations3.2%LOW
Core PCE Price Index m/m
SourceBureau of Economic Analysis (latest release)
MeasuresChange in the price of goods and services purchased by consumers, excluding food and energy;
Usual EffectActual > Forecast = Good for currency;
FrequencyReleased monthly, about 30 days after the month ends;
Next ReleaseMay 1, 2014
FF NotesDiffers from Core CPI in that it only measures goods and services targeted towards and consumed by individuals. Prices are weighted according to total expenditure per item which gives important insights into consumer spending behavior. This is rumored to be the Federal Reserve's favorite inflation measure, but CPI is released about 15 days earlier and tends to garner most of the attention;
Acro ExpandPersonal Consumption Expenditures (PCE), Consumer Price Index (CPI);
SourceBureau of Economic Analysis (latest release)
Personal Spending m/m
SourceBureau of Economic Analysis (latest release)
MeasuresAnnualized change in the inflation-adjusted value of all goods and services produced by the economy;
Usual EffectActual > Forecast = Good for currency;
FrequencyReleased quarterly, about 90 days after the quarter ends;
Next ReleaseJun 25, 2014
FF NotesWhile this is q/q data, it's reported in an annualized format (quarterly change x4). The 'Previous' listed is the 'Actual' from the Preliminary release and therefore the 'History' data will appear unconnected. There are 3 versions of GDP released a month apart - Advance, Preliminary, and Final. The Advance release is the earliest and thus tends to have the most impact;
Why Traders
Care
It's the broadest measure of economic activity and the primary gauge of the economy's health;
Revised UoM Consumer Sentiment
SourceUniversity of Michigan (latest release)
MeasuresLevel of a composite index based on surveyed consumers;
Usual EffectActual > Forecast = Good for currency;
FrequencyReleased monthly, usually on the last Friday of the current month;
Next ReleaseApr 25, 2014
FF NotesThe 'Previous' listed is the 'Actual' from the Preliminary release and therefore the 'History' data will appear unconnected. There are 2 versions of this data released about 15 days apart – Preliminary and Revised. The Preliminary release is the earliest and thus tends to have more impact;
Derived ViaSurvey of about 500 consumers which asks respondents to rate the relative level of current and future economic conditions;
Also CalledReuters/University of Michigan Consumer Sentiment;
Acro ExpandUniversity of Michigan (UoM);

Thursday, March 27, 2014

GOLD | SILVER | COPPER | CRUDE Technical Analysis

GOLD
Gold edged slightly higher overnight to open at 1313.50/1314.50, which was also the intraday high. Following the open it dipped to a low of 1300.25/1301.25 as the dollar strengthened and equities gained momentum following better-than-expected U.S. economic data that showed an increase in sales of durable goods. The slide in gold prices was also attributed to easing of tensions between Russia and the West, which suppressed demand for safe haven assets. The metal closed the day at 1302.50/1303.50.
GOld Chart Gold traded lower today, closing at 1302 and coming dangerously close to the 200-day moving average at 1296. A close below that level would be our stop-loss on our long-term bullish gold view. Resistance is at 1316/17, the high of the past two sessions.
Gold fell as encouraging U.S. manufacturing data reduced bullion’s appeal to institutional investors as a hedge against economic uncertainty
U.S. Federal Janet Yellen suggested interest rates could rise in the first half of 2015, raised the opportunity cost of holding non-yielding bullion.
SPDR gold trust holding dropped by 1.80 tonnes i.e. 0.22% to 816.97 tonnes from 818.77 tonnes.
SILVER
Silver was mostly unchanged overnight, opening at 19.97/20.02. It briefly climbed to a high of 20.01/20.06 before retreating on the back of gold to a low of 19.73/19.78, prior to concluding the session below the $20 mark at 19.76/19.81.
Silver had a bearish close today, closing lower at 19.76. We are bearish silver, looking for a test of the base of the consolidation that has been in place since early December, around the 18.83 low.
Silver Chart The gold-silver ratio is trading higher today at 65.90. There is support at 65.02, the 76.4% retracement of the last downtrend in the ratio from 67.47 high to 57.09 low. Uptrend support comes in at 62.99. We are bullish the ratio, targeting a test of the double top in the 67.50 area.
Silver prices dropped after official data showed that U.S. orders for long lasting manufactured goods came in higher-than-forecast in February.
Prices has been under heavy selling pressure amid growing expectations that the Federal Reserve will raise interest rates sooner than expected.
The Commerce Department reported that U.S. durable goods orders rose 2.2% last month, snapping two months of declines and surpassing expectations for a 1% increase.
COPPER
On the Comex division of the New York Mercantile Exchange, copper futures for May delivery fell to a session low of $2.982 a pound, before trimming losses to last trade at $2.985 during European morning hours, down 0.68%, or 2.0 cents.
Copper rallied to $3.045 a pound on Tuesday, the most since March 11, before settling at $3.005 a pound, up 2.04%, or 6.0 cents.
Futures were likely to find support at $2.939 a pound, the low from March 25 and resistance at $3.045 a pound, the high from March 25.
Copper Chart The U.S. is to release data on durable goods orders later in the session.
Data on Tuesday showed that U.S. consumer confidence improved more than expected in March. However, a separate report said that new home sales fell by the most in five months in February, indicating continued weakness in the housing sector.
Copper rallied on Tuesday amid growing hopes that China will unveil fresh stimulus measures to boost slowing economic growth.
Data released on Monday showed that Chinese manufacturing activity deteriorated for a third successive month in March.
The industrial metal fell to $2.877 a pound on March 19, the lowest since July 2010, amid growing concerns over the health of China’s economy.
Copper prices fell from the previous session’s two-week high on Wednesday, as investors looked ahead to key U.S. economic data later in the day for further indications on the strength of the economy and the future course of monetary policy.
CRUDE
On the New York Mercantile Exchange, West Texas Intermediate crude oil for delivery in May traded at $100.32 a barrel, up 0.05%, after hitting an overnight session low of $99.11 a barrel and a high of $100.13 a barrel.
Prices for the global Brent oil futures contract rose four cents to settle at $107.03 a barrel on the ICE Futures Europe exchange on Wednesday.
Crude Chart Overnight, oil prices firmed after the Commerce Department reported that U.S. durable goods orders rose 2.2% in February, wiping out two months of declines and surpassing expectations for a 1.0% increase.
Core durable goods orders, which exclude transportation items, inched up 0.2%, slightly below forecasts for a 0.3% gain.
The numbers fueled expectations for a more sustained pickup in the U.S. economy, which should hike demand for more fuel and energy.
Weekly inventory data gave oil prices a boost as well.
The U.S. Energy Information Administration said in its weekly report that U.S. crude oil inventories rose by 6.6 million barrels in the week ended March 21, above expectations for an increase of 2.8 million barrels.
The EIA also reported a 1.3 million barrel draw at a delivery point in Cushing, Oklahoma, which was larger expected and eclipsed the otherwise bearish 6.6 million-barrel build.
Total U.S. crude oil inventories stood at 382.5 million barrels as of last week.
Crude oil prices edged slightly higher in Asia on Thursday from a morning drop that followed overnight gains on better-than-expected reports on U.S. durable goods and oil inventories.
Technical Levels
SUPPORT 1 SUPPORT 2 RESISTANCE 1 RESISTANCE 2
GOLD 1296 1288 1314 1324
SILVER 19.67 19.59 20.08 20.16
COPPER 2.9930 2.9755 3.0380 3.0830
CRUDE 99.42 98.58 100.78 101.30
Global Economic Data
TIME :IST DATA PRV EXP IMPACT
6.00P.M Unemployment Claims 320k 326k STRONG
6.00P.M FOMC Member Pianalto Speaks MEDIUM
6.00P.M Final GDP q/q 2.4% 2.7% MEDIUM
7.30P.M Pending Home Sales m/m 0.1% 0.1% STRONG
Unemployment Claims
Source Department of Labor (latest release)
Measures The number of individuals who filed for unemployment insurance for the first time during the past week;
Usual Effect Actual < Forecast = Good for currency;
Frequency Released weekly, 5 days after the week ends;
Next Release Apr 3, 2014
FF Notes This is the nation’s earliest economic data. The market impact fluctuates from week to week – there tends to be more focus on the release when traders need to diagnose recent developments, or when the reading is at extremes;
Why Traders
Care
Although it’s generally viewed as a lagging indicator, the number of unemployed people is an important signal of overall economic health because consumer spending is highly correlated with labor-market conditions. Unemployment is also a major consideration for those steering the country’s monetary policy;
Also Called Jobless Claims, Initial Claims;
Final GDP q/q
Source Bureau of Economic Analysis (latest release)
Measures Annualized change in the inflation-adjusted value of all goods and services produced by the economy;
Usual Effect Actual > Forecast = Good for currency;
Frequency Released quarterly, about 90 days after the quarter ends;
Next Release Jun 25, 2014
FF Notes While this is q/q data, it’s reported in an annualized format (quarterly change x4). The ‘Previous’ listed is the ‘Actual’ from the Preliminary release and therefore the ‘History’ data will appear unconnected. There are 3 versions of GDP released a month apart – Advance, Preliminary, and Final. The Advance release is the earliest and thus tends to have the most impact;
Why Traders
Care
It’s the broadest measure of economic activity and the primary gauge of the economy’s health;
Pending Home Sales m/m
Source National Association of Realtors (latest release)
Measures Change in the number of homes under contract to be sold but still awaiting the closing transaction, excluding new construction;
Usual Effect Actual > Forecast = Good for currency;
Frequency Released monthly, about 28 days after the month ends;
Next Release Apr 28, 2014
FF Notes This data is released about a week later than Existing Home Sales, but it’s more forward-looking as a contract is signed several weeks before the home is counted as sold;
Why Traders
Care
It’s a leading indicator of economic health because the sale of a home triggers a wide-reaching ripple effect. For example, renovations are done by the new owners, a mortgage is sold by the financing bank, and brokers are paid to execute the transaction;
Also Called Pending Resales;
Source National Association of Realtors (latest release)

Thursday, March 20, 2014

Singapore and Malaysia Stock Market Technical Analysis Report

Market forecast for STI: Today’s performance of STI makes a Red candle & the formation of inverted hammer, where it has a small real body and a long shadow. Further the Moving Average Envelops shows that the STI is in consolidate phase and trading in a tight range where it’s becoming difficult for STI to sustain above the level of 3100.

Technical indicators:
RSI is under the base line @40.87 & MACD is moving flat where the CCI is performing at -151.88

STRAITS TIME  LEVELS


Support 1
3045
Support 2
3032
Support 3
3020
Resistance 1
3065
Resistance 2
3080
Resistance 3
3095
 Important Factor for today:-
  • 30.2% increase in share price of Asiatravel between Tuesday & Wednesday further SGX made a red alert for it.
  • SGX is about to revise the fee structure which will be applicable from 2nd May 2014 as to make the trading more cost effective the clearing fee would be reduced by one fifth from 0.04% to 0.325% of contract value.
Market Review for KLCI:
Today KLCI opened at 1814.29 and touched the high of 1818.17 further closed at the high. Today the green candle was formed for the day.
Market forecast for KLCI:
Hammer Pattern was formed by the todays candle with the small body and long shadow. Studding the Bollinger Bands it can be said that the KLCI is in the Over Sold position and can take a recovery for the up side. Where there is a flat move for the EMA.
Technical indicators:
RSI is just bellow the base line @48.19. Where the CCI is performing at -92.44.
KLCI LEVELS


Support 1
1805
Support 2
1792
Support 3
1778
Resistance 1
1825
Resistance 2
1838
Resistance 3
1852

 
Design by Free WordPress Themes | Bloggerized by Lasantha - Premium Blogger Themes | Grants For Single Moms