*Free SGX Stock Picks* Special Offer!
Showing posts with label forex strategy. Show all posts

Monday, June 23, 2014

FOREX Weekly Forecast by Technical Analysis

EUR/USD
The U.S. currency had the biggest weekly decline against the euro in two months as the Fed announced June 18 it will reduce monthly bond-buying while holding its interest-rate target at virtually zero.
 The pound rose for a third week as traders had the most bullish futures wagers since 2007. A gauge of currencies volatility increased from a record low. EUR/USD gains were enabled as the European Commission asserted that the Eurozone’s economic outlook is improving. The Brussels-based institution now sees the Eurozone’s economy expanding by 1.2 per cent this year, up slightly from the 1.1 per cent previously forecast. They also see the unemployment rate in the currency bloc edging to 12 per cent.
Forecast:
The EUR/USD pair broke higher during the course of the week, using the 1.35 level as support. That being the case, it looks as we continue to bounce around in this general vicinity, using the 200 pips as the range for the market right now. Long-term traders will probably avoid this market, but short-term traders will probably find it very profitable as it looks very well contained and we have very obvious support and resistance levels. However, if we do get above the 1.37 level, we feel that the market will finally go back towards a 1.40 handle. A move below the 1.35 level since this market down to the 1.33 handle.
USD/JPY
The USD/JPY ended the week at the 102 range while traders closely monitor the conflict in Iran moving to safe havens while the geopolitical situation boils over. 
In overseas trading overnight, the dollar briefly rose to around ¥102 thanks to a rise in U.S. long-term interest rates following favorable economic data, including the Federal Reserve Bank of Philadelphia’s manufacturing index for June. The dollar was later stuck in a narrow range around ¥101.85.
Forecast:
The USD/JPY pair went back and forth over the course of the week, as continue to meander in a fairly tight consolidation area. It’s a bit difficult for longer-term traders to be involved in this market, and until it break well above the 103 level, we do not see much of a trade to the long side. As far selling is concerned, we think that there is simply far too much support below to even consider it at this point in time. Ultimately, this market breaks out to the upside, but it might take a while.
GBP/USD
With the British Pound currently trading close to a five-year high against the US Dollar, news of the Federal Reserve’s policy meeting can only help enhance the Pound Sterling to US Dollar exchange rate relationship further. 
Thursday has seen the UK retail sales report fall slightly short of predictions; however it’s still lent the Pound some underlying support. The Pound is displaying stability against the US Dollar as the US Federal Reserve is currently showing no intention of increasing interest rates. The Federal Open Market Committee also dropped its initial forecast of a long term interest rate from 4-3.75%.
Forecast:
The GBP/USD pair went back and forth during the course of the week, but closed above the 1.70 handle, a significant move to the upside. That was a pretty strong barrier for us, and we believe that it opens the way to the 1.75 level as a target. It will probably take a bit of time, but we do believe that eventually that level gets hit. If we pull back from here, we would fully anticipate buyers stepping into the market and lifting the British pound yet again.
AUD/USD
The AUD/USD ended the week close to the 94 mark at 0.9383 staying strong after positive data and promises from the Chinese Premier that China will meet its growth expectations regardless of what the government needs to do. 
The currency soared after the FOMC meeting on Wednesday. The ‘Aussie’ fell from its highest level in two months against the US Dollar after peaking at 94.33, the highest level witnessed since April 10th. The Australian dollar has more than shaken off a slight dovish shift by the Reserve Bank of Australia and has not spent much time beneath 94 cents since the FOMC meeting.  It seems likely the market would at some stage like to inquire as to what kind of supply is above 94.4 cents.
Forecast:
The Australian Dollar is now expected to fall against the US Dollar at a quickening pace as the US economy improves and commodity prices fall. The AUD/USD pair went back and forth over the course of the week forming a neutral candle. This neutral candle is still within the consolidation area that we have been in for some time, thereby not really telling us much other than the pressure to breakout to the upside continues. Because of this, we believe that ultimately the Australian dollar does again, but the market has some work to do to make that happen. If we can get a move above the 0.95 handle, we believe that this market goes to the parity level given enough time.
Currency Data from 23 – 27 june
Date Time Currency Impact Particular Forecast Previous
Mon Jun 23 7:15am CNY HIGH HSBC Flash Manufacturing PMI 49.7 49.4

11:30am JPY HIGH BOJ Gov Kuroda Speaks


2:30pm EUR HIGH French Flash Manufacturing PMI 49.6 49.6

1:00pm EUR HIGH German Flash Manufacturing PMI 52.7 52.3

7:30pm USD HIGH Existing Home Sales 4.74M 4.65M
Tue Jun 24 2:00pm GBP HIGH Inflation Report Hearings


7:30pm USD HIGH CB Consumer Confidence 83.6 83


USD HIGH New Home Sales 442K 433K
Wed Jun 25 6:00pm USD HIGH Core Durable Goods Orders m/m 0.003 0.003
Thu Jun 26 3:00pm GBP HIGH BOE Gov Carney Speaks


6:00pm USD HIGH Unemployment Claims 314K 312K
Fri Jun 27 4:15am NZD HIGH Trade Balance 250M 534M

All Day EUR HIGH German Prelim CPI m/m 0.002 -0.001

2:00pm GBP HIGH Current Account -17.1B -22.4B

Thursday, March 27, 2014

GOLD | SILVER | COPPER | CRUDE Technical Analysis

GOLD
Gold edged slightly higher overnight to open at 1313.50/1314.50, which was also the intraday high. Following the open it dipped to a low of 1300.25/1301.25 as the dollar strengthened and equities gained momentum following better-than-expected U.S. economic data that showed an increase in sales of durable goods. The slide in gold prices was also attributed to easing of tensions between Russia and the West, which suppressed demand for safe haven assets. The metal closed the day at 1302.50/1303.50.
GOld Chart Gold traded lower today, closing at 1302 and coming dangerously close to the 200-day moving average at 1296. A close below that level would be our stop-loss on our long-term bullish gold view. Resistance is at 1316/17, the high of the past two sessions.
Gold fell as encouraging U.S. manufacturing data reduced bullion’s appeal to institutional investors as a hedge against economic uncertainty
U.S. Federal Janet Yellen suggested interest rates could rise in the first half of 2015, raised the opportunity cost of holding non-yielding bullion.
SPDR gold trust holding dropped by 1.80 tonnes i.e. 0.22% to 816.97 tonnes from 818.77 tonnes.
SILVER
Silver was mostly unchanged overnight, opening at 19.97/20.02. It briefly climbed to a high of 20.01/20.06 before retreating on the back of gold to a low of 19.73/19.78, prior to concluding the session below the $20 mark at 19.76/19.81.
Silver had a bearish close today, closing lower at 19.76. We are bearish silver, looking for a test of the base of the consolidation that has been in place since early December, around the 18.83 low.
Silver Chart The gold-silver ratio is trading higher today at 65.90. There is support at 65.02, the 76.4% retracement of the last downtrend in the ratio from 67.47 high to 57.09 low. Uptrend support comes in at 62.99. We are bullish the ratio, targeting a test of the double top in the 67.50 area.
Silver prices dropped after official data showed that U.S. orders for long lasting manufactured goods came in higher-than-forecast in February.
Prices has been under heavy selling pressure amid growing expectations that the Federal Reserve will raise interest rates sooner than expected.
The Commerce Department reported that U.S. durable goods orders rose 2.2% last month, snapping two months of declines and surpassing expectations for a 1% increase.
COPPER
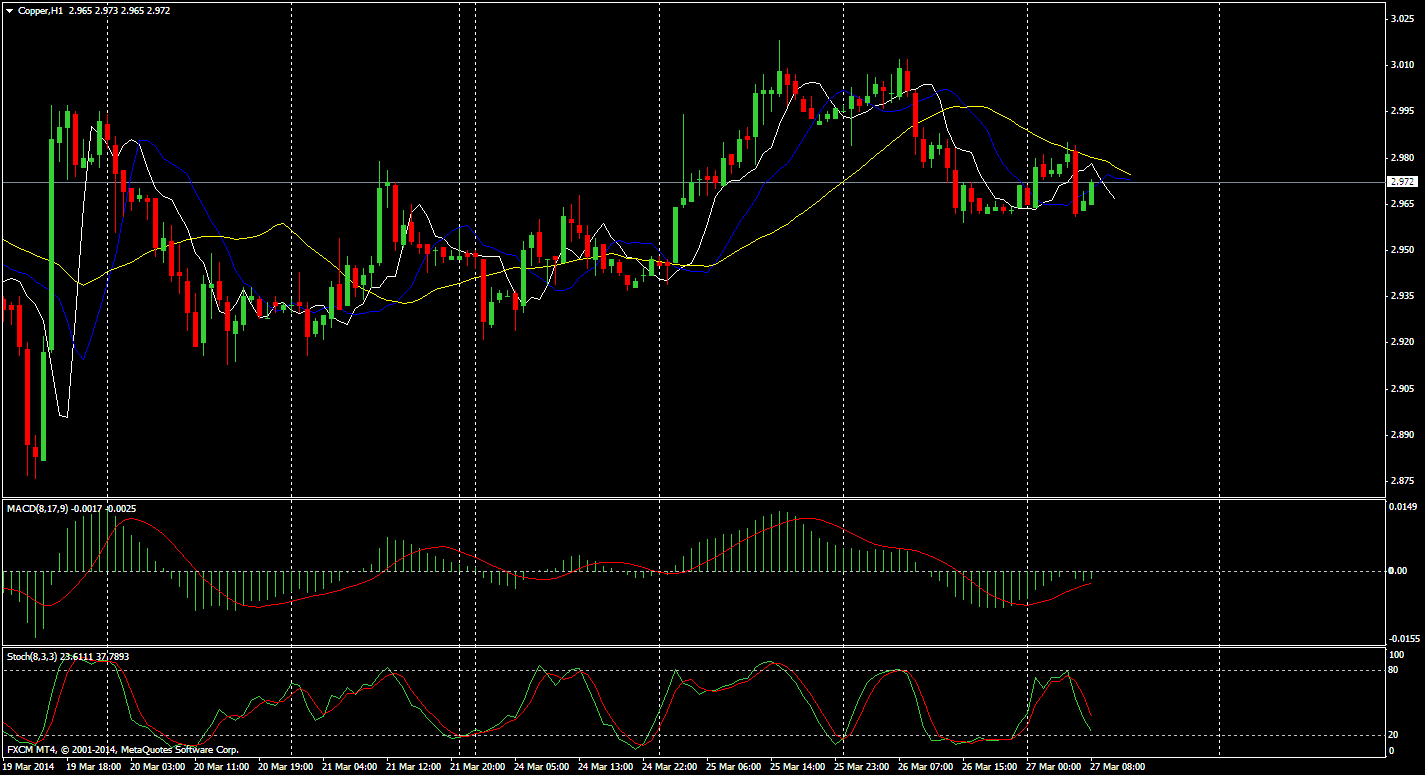
On the Comex division of the New York Mercantile Exchange, copper futures for May delivery fell to a session low of $2.982 a pound, before trimming losses to last trade at $2.985 during European morning hours, down 0.68%, or 2.0 cents.
Copper rallied to $3.045 a pound on Tuesday, the most since March 11, before settling at $3.005 a pound, up 2.04%, or 6.0 cents.
Futures were likely to find support at $2.939 a pound, the low from March 25 and resistance at $3.045 a pound, the high from March 25.
Copper Chart The U.S. is to release data on durable goods orders later in the session.
Data on Tuesday showed that U.S. consumer confidence improved more than expected in March. However, a separate report said that new home sales fell by the most in five months in February, indicating continued weakness in the housing sector.
Copper rallied on Tuesday amid growing hopes that China will unveil fresh stimulus measures to boost slowing economic growth.
Data released on Monday showed that Chinese manufacturing activity deteriorated for a third successive month in March.
The industrial metal fell to $2.877 a pound on March 19, the lowest since July 2010, amid growing concerns over the health of China’s economy.
Copper prices fell from the previous session’s two-week high on Wednesday, as investors looked ahead to key U.S. economic data later in the day for further indications on the strength of the economy and the future course of monetary policy.
CRUDE
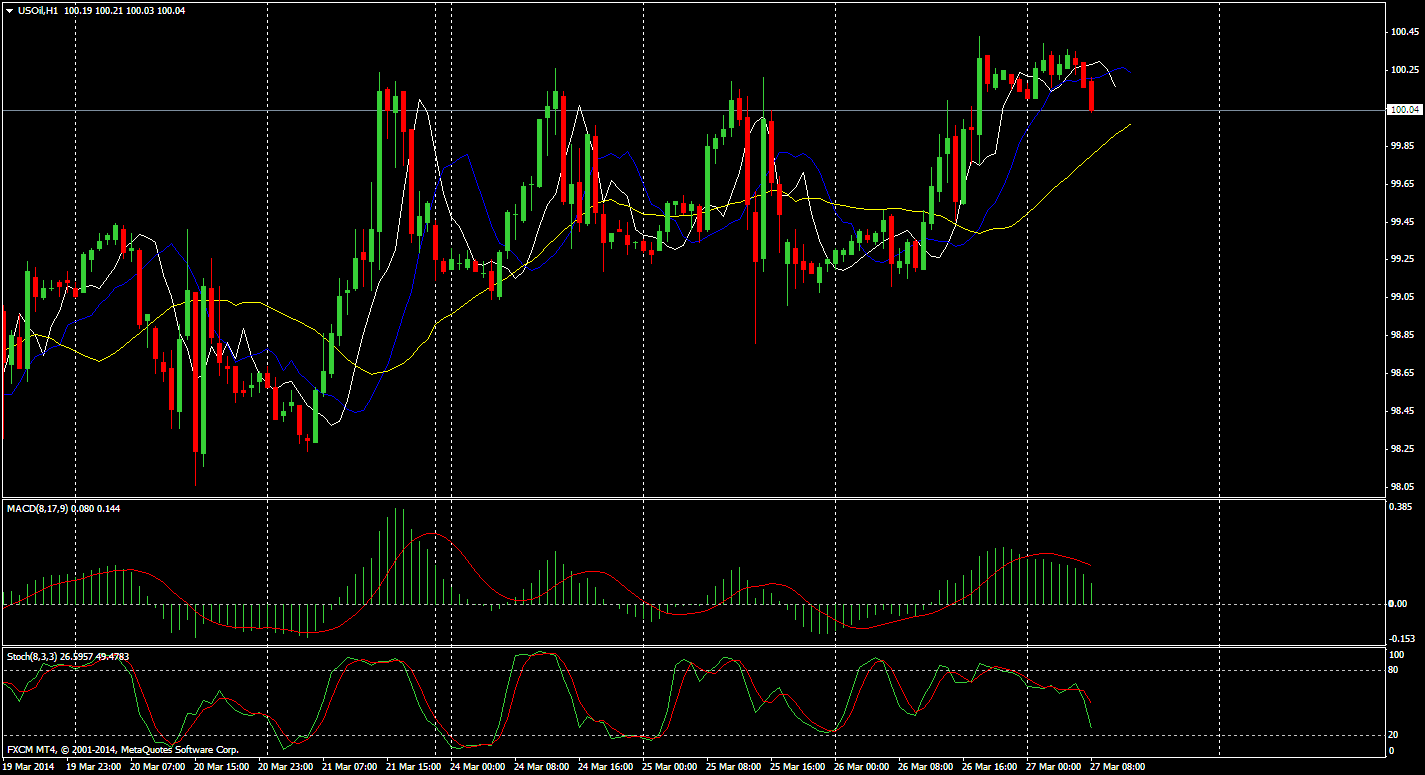
On the New York Mercantile Exchange, West Texas Intermediate crude oil for delivery in May traded at $100.32 a barrel, up 0.05%, after hitting an overnight session low of $99.11 a barrel and a high of $100.13 a barrel.
Prices for the global Brent oil futures contract rose four cents to settle at $107.03 a barrel on the ICE Futures Europe exchange on Wednesday.
Crude Chart Overnight, oil prices firmed after the Commerce Department reported that U.S. durable goods orders rose 2.2% in February, wiping out two months of declines and surpassing expectations for a 1.0% increase.
Core durable goods orders, which exclude transportation items, inched up 0.2%, slightly below forecasts for a 0.3% gain.
The numbers fueled expectations for a more sustained pickup in the U.S. economy, which should hike demand for more fuel and energy.
Weekly inventory data gave oil prices a boost as well.
The U.S. Energy Information Administration said in its weekly report that U.S. crude oil inventories rose by 6.6 million barrels in the week ended March 21, above expectations for an increase of 2.8 million barrels.
The EIA also reported a 1.3 million barrel draw at a delivery point in Cushing, Oklahoma, which was larger expected and eclipsed the otherwise bearish 6.6 million-barrel build.
Total U.S. crude oil inventories stood at 382.5 million barrels as of last week.
Crude oil prices edged slightly higher in Asia on Thursday from a morning drop that followed overnight gains on better-than-expected reports on U.S. durable goods and oil inventories.
Technical Levels
SUPPORT 1 SUPPORT 2 RESISTANCE 1 RESISTANCE 2
GOLD 1296 1288 1314 1324
SILVER 19.67 19.59 20.08 20.16
COPPER 2.9930 2.9755 3.0380 3.0830
CRUDE 99.42 98.58 100.78 101.30
Global Economic Data
TIME :IST DATA PRV EXP IMPACT
6.00P.M Unemployment Claims 320k 326k STRONG
6.00P.M FOMC Member Pianalto Speaks — — MEDIUM
6.00P.M Final GDP q/q 2.4% 2.7% MEDIUM
7.30P.M Pending Home Sales m/m 0.1% 0.1% STRONG
Unemployment Claims
Source Department of Labor (latest release)
Measures The number of individuals who filed for unemployment insurance for the first time during the past week;
Usual Effect Actual < Forecast = Good for currency;
Frequency Released weekly, 5 days after the week ends;
Next Release Apr 3, 2014
FF Notes This is the nation’s earliest economic data. The market impact fluctuates from week to week – there tends to be more focus on the release when traders need to diagnose recent developments, or when the reading is at extremes;
Why Traders
Care
Although it’s generally viewed as a lagging indicator, the number of unemployed people is an important signal of overall economic health because consumer spending is highly correlated with labor-market conditions. Unemployment is also a major consideration for those steering the country’s monetary policy;
Also Called Jobless Claims, Initial Claims;
Final GDP q/q
Source Bureau of Economic Analysis (latest release)
Measures Annualized change in the inflation-adjusted value of all goods and services produced by the economy;
Usual Effect Actual > Forecast = Good for currency;
Frequency Released quarterly, about 90 days after the quarter ends;
Next Release Jun 25, 2014
FF Notes While this is q/q data, it’s reported in an annualized format (quarterly change x4). The ‘Previous’ listed is the ‘Actual’ from the Preliminary release and therefore the ‘History’ data will appear unconnected. There are 3 versions of GDP released a month apart – Advance, Preliminary, and Final. The Advance release is the earliest and thus tends to have the most impact;
Why Traders
Care
It’s the broadest measure of economic activity and the primary gauge of the economy’s health;
Pending Home Sales m/m
Source National Association of Realtors (latest release)
Measures Change in the number of homes under contract to be sold but still awaiting the closing transaction, excluding new construction;
Usual Effect Actual > Forecast = Good for currency;
Frequency Released monthly, about 28 days after the month ends;
Next Release Apr 28, 2014
FF Notes This data is released about a week later than Existing Home Sales, but it’s more forward-looking as a contract is signed several weeks before the home is counted as sold;
Why Traders
Care
It’s a leading indicator of economic health because the sale of a home triggers a wide-reaching ripple effect. For example, renovations are done by the new owners, a mortgage is sold by the financing bank, and brokers are paid to execute the transaction;
Also Called Pending Resales;
Source National Association of Realtors (latest release)

Thursday, February 27, 2014

Singapore SGX- STI Technical Analysis Report


Market Review: 
Singapore equities recover inch today, after its previous day free fall. However STI closed below 3100 mark.

STI Day Performance

Open
3085.54
High
3101.36
Low
3082.86
Close
3096.74
Change(Points)
+8.49
% Change
+0.28%
Volume
2634.6M
Rise
214
Fall
195
Unch
643
Market forecast:
  • STI opened flat @ 3085.50 and then its made day low 3082.86 above then previous days lower level and finally closed near to day high @ 3096.74 level just below 3100 level.
  • STI formed a green candlestick as it traded higher side, and closed near to day high. This is a bullish sign.
  • STI currently traded above 50 & 20 day EMA level , so whenever it maintain above these level it will be in bullish zone.
Support level:
STI having immediate support @ 3080 level and below this level it can take support @3060-3040 will be the support zone for STI.
Resistance:
STI having immediate Resistance @3105 and above this level it may take resistance @ 3120-3135

STRAITS TIME LEVELS
Support 1
3080
Support 2
3060
Support 3
3040
Resistance 1
3105
Resistance 2
3120
Resistance 3
3135
Technical indicators: 
Technical indicators MACD, RSI and CCI are trading in recovery mode, RSI is in oversold zone so we can expect recovery in it.
Important Factor for today:-
  • Allianz raised its dividend by almost a 5th after fourth-quarter net profit met expectations at 1.26 billion euros (US$1.72 billion), as a strong operating gain in property and casualty insurance offset declines elsewhere..
  • United Overseas Australia Ltd has achieved a $219.2 million operating profit for the financial year ended 31st December 2013. After taxation and non-controlling interests, the profit applicable to the members of the Company was $97.8 million, an increase of $15.8 million or 19.3% when compared with the 2012 profit result.
  • City Developments: 4Q13 Net Profit Down 11.4% to S$221 Million, Declared S$0.08 Final Dividend.
  • Yangzijiang acquisition Of Remaining 45.53% Stake In Jiangsu Runzhou Heavy Industry Co., For US$5.46 Million.
  • Yanlord FY 2013 Revenue Rises 9.5% to RMB11.28 Billion, Strong Pre-Sales Growth And Subsequent Recognition To Drive Future.

Top 5 Gainers
Top 5 Losers
Scrip Name
CMP
%change
Scrip Name
CMP
%change
GoldenAgr
0.565
4.63
THBEV
0.51
-1.92
Jardine C&C
38.09
2.92
HPH Trust US$
0.62
-1.59
SGX
6.94
1.31
Wilmar
3.47
-0.57
SembMar
4.08
1.24
JMH 400US$
55.3
-0.36
Genting SP
1.355
1.12
DBS
16.4
-0.3

Friday, March 23, 2012

Currency Forex Trading - Live Updates

IMF Threatens to Cut Off Greece if €12 Billion of Austerity Isn’t Made in 3 Months
A new report by the International Monetary Fund on Greece requires 12 billion euros of more austerity measures in order to close the funding gap for both 2013 and 2014.
The IMF expects Greece to pass these new measures within the next three months. Otherwise, it will withhold the next tranche of aid to Greece, due in 3 months. This goes to show that the successful completion of the second bailout for Greece just bought more time, even though it finally included a huge restructuring of debt, worth over €00 billion of debt forgiveness.

US Jobless Claims Drop Below 350K
The number of employment claims dropped to 348K in the US, a bit better than 353K that was expected. Last week’s number was revised from 351K to 353K. All in all, the figures are within expectations and point to the same gradual improvement seen beforehand in the US labor market.

Get All Forex Updates. Live Forex Recommendation, live Trading strategy.  Just Check all Calls Here

 
Design by Free WordPress Themes | Bloggerized by Lasantha - Premium Blogger Themes | Grants For Single Moms