*Free SGX Stock Picks* Special Offer!

Friday, March 11, 2016

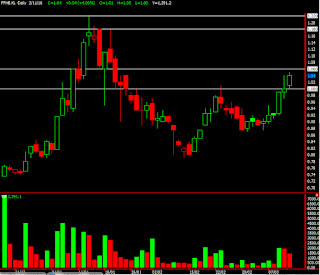
FFHB( 5584.KL) ENTER ABOVE 1.06 : TARGET 1.12/1.18

EXECUTIVE SUMMARY
FFHB is following long term uptrend. FFHB rebounded after taking support at 0.87 after a short term downtrend. It is having its resistance at 1.06. It is expected to breaks its resistance of 1.06 and move up to the target of 1.18. Looking at its previous trend, it is expected to go up to 1.12 in short term. It is technically strong counter supported by RSI, Bollinger bands and other technically indicators which are giving a strong signal of bullish trend ahead. Its a nice opportunity to buy above 1.06 and gain a considerable amount of net profit in contra. Free Trial Signals
Technical Justification
Looking at it technically FFHB took support at 0.87. It is following long term uptrend and is expected to continue its trend. It has recent given the breakout for double bottom indicating bullish trend in near future. Its near term support is at 1.00 followed by long term support at 0.87. It has its resistance at 1.06 as soon as it breaks this resistance it is expected to move up to our target price of 1.12/1.18 in contra.
FFHB is following uptrend and is increasing at a particular pace. It did not break its trend line and rebounded above it by taking support at 0.87, indicating bullishness in near future.
BOLLINGER BANDS
The price has touched the upper band. Both lower and upper bands are moving upward and hence indicating strong uptrend. FFHB is expected to increase till it is going along with the upper band.
MONIG AVERAGE CONVERSION DIVERSION (MACD)
Simple MACD has arose a bullish signal. The faster moving average curve has given cross-over to the slowest moving average curve from below strengthening bullish trend ahead.
RELATIVE STRENGTH INDEX
RSI is above 50 , currently at 67.369. Which indicated that the investors are buying the counter and hence it is expected the price would take the uptrend due to buying pressure.
TRADING VIEW
Trading should be calculative and done at correct levels. It is very important to make entry and exit at right level. An investor should always enter above the resistance level and should close his position as soon as the price has achieved the target or has hit the SL (stop loss). The entry level of FFHB is above 1.06 with SL of 1.00 and target price of 1.12/1.18.

Tuesday, March 8, 2016

EURUSD Edged Higher Bouncing Off and Crude Oil Jumped After the US Opening

EUR/USD 
EURUSD edged higher bouncing off of support near the 10-day moving average at 1.0950. The currency pair is likely to consolidate until the ECB meets and the markets are able to absorb the new information. This came following a worse than expected sentiment report. Resistance is seen near the February high at 1.1375. Momentum remains negative as the MACD index prints in the red with a downward sloping trajectory. The RSI turned higher with price action reflecting accelerating positive momentum, while printing a reading of 50, which is in the middle of the neutral range. 
GBP/USD
GBPUSD initially fell during the day on Monday, but turned back around to form a very positive candle. The hammer suggests that we are going to go higher, but the biggest problem that we have us going long of this market is not only is in a bit overextended at this point in time, but we do have quite a bit of noise just above. Because of this, we are going to simply sit on the sidelines in this particular market. While we do recognize the potential for a move higher, the reality is that it is going to be a very hard trade to hold onto.
AUD/USD
AUDUSD continued to break higher during the course of the day on Monday, testing the 0.75 level. If we can break above there, we should continue to go much higher, but quite frankly we are a bit overextended at this point so we will have to wait to see whether or not a pullback occurs that we can take advantage of as it would offer value in what is obviously a massive break out to the upside. We have no plans to sell at this point in time, and believe that the trend has turned around.
USD/JPY 
USDJPY fell just a little bit during the course of the session here on Monday, but we are still very much in the way of consolidation, so having said that it is probably best to sit on the sidelines when it comes to this market. Quite frankly, the easiest trade in this market is to buy above the 115 level, as it would show a significant breakout above resistance. At this point in time, that’s essentially what we are waiting for and as a result will be hesitant to get involved at this point in time.
GOLD
Gold market took a positive move for the beginning of the week and showed the potential of the buyers as the previous candle was a Doji and we were expecting the market to go down but the interest of the buyer lead the price of yellow metal to 1273 handle now looking at the chart we are waiting for the price to break the resistance and open a new range of profit booking.
Forecast
We need to wait for the price to break the 1273 handle and this can lead to 1293 levels where the lower side support can be placed at 1259.
CRUDE
Crude oil was already moving in a gap up pricing, after all day consolidation the prices again jumped after the US opening and broke the $ 37 handle this lead to the main change in the price and trend of the crude oil. Now we find the major resistance at $ 38.25 if the buyers lead the market then we have a wide range to cover at part of profit.
Forecast
Buying in oil after $ 38.50 can lead the price for $ 41.00 where on the lower end we can wait for the price of $ 35.00

The FBM KLCI fell 5.50 points till Noon

The FBM KLCI retreated at the midday break today in line with the profit taking at most regional markets. At 12.30pm, the FBM KLCI fell 5.50 points to 1,692.43. The index had earlier risen to its intra-morning high of 1,706.08. 3 Days Free Trial Signals
Losers outpaced gainers by 469 to 214, while 344 counters traded unchanged. Volume was 1.15 billion shares valued at RM907.60 million.
The top losers included British American Tobacco (M) Bhd, Genting Bhd, Ta Ann Resources Bhd, Hartalega Holdings Bhd, Gadang Holdings Bhd, Top Glove Corporation Bhd, Latitude Tree Holdings Bhd, Nestle (M) Bhd and Can-One Bhd.
The actives included Chin Hin Group Bhd, AirAsia X Bhd, XOX Bhd, AirAsia Bhd, Bumi Armada Bhd, Sumatec Reources Bhd and APFT Bhd.
The top gainers included Carlsberg Brewery (M) Holdings Bhd, Chin Hin, Amway (M) Holdings Bhd, Kuala Lumpur Kepong Bhd, Aturmaju Holdings Bhd, Ann Joo Resources Bhd and My E.G. Services Bhd.
Asian shares fell on Tuesday as investors took profits after a month-long rally and investors grew wary of the market's near-term prospects ahead of major central bank meetings, according to Reuters.
Led by China, MSCI's broadest index of Asia-Pacific shares outside Japan fell more than a percent. Japan's Nikkei and South Korea's KOSPI fell more than a percent each, it said.
BIMB Securities Research said that in Asia, key indices closed mixed yesterday with rally in China as investors focused on the country’s plans to prop up the slowing economy while Japanese market ended negative on profits taking.
“Back home, the FBMKLCI closed higher, added 5.44 points or 0.32% to 1,697.93, lifted by heavyweights such as Genting, Maybank and YTL.
“Trading participation saw net buying by foreign institutions and local retail while local institutions were net sellers.
“We expect the local market trend sideways due to lack of fresh catalysts with the index to hover around 1,695-1,700,” it said.

 
Design by Free WordPress Themes | Bloggerized by Lasantha - Premium Blogger Themes | Grants For Single Moms