*Free SGX Stock Picks* Special Offer!

Thursday, March 28, 2013

Straits Times Index - Market Weekly Outlook for Next Week 01st-04th April


Market Forecast for week ahead:
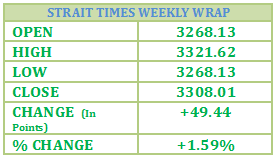
  • STI closed its 7 week high level above 3300 mark @ 3308.1 levels. Took support near to 3365 levels and recovers very well.
  • STI formed a candlestick pattern called “opening marubozu” is a type of candlestick characterized with a very long body and no lower shadow. It has only a short upper shadow. This is a strong bullish candlestick pattern.
  • This shows that the day opened and then the prices continued to go up all day long without coming below the opening level thus forming a long white body, however prices did not close at the high of the day and thus they created an upper shadow. It is a typical bull day and strength of the bulls is enough to cause some concern among the bears. A White Opening Marubozu, on the other end, does not show as much bullish strength as in the case of White Marubozu.
  • STI trading in a consolidation phrase between the ranges of 3220-3320 levels, either side breakout will give the clear move for coming days.
STI Resistance:
  • STI having Resistance @ 3320 and above this level it may take resistance from 3335-3350 levels.
STI Support:
  • STI having nearest support @ 3260 below this 3240-3220 will be the support area for market.
Technical Indicators:
Technical indicators are giving bullish impression.MACD looking good.RSI trading above its centreline @ 67.336 and CCI also turning upwards and trading at 79.92.

Support 1Support 2Support 3Resistance 1Resistance 2Resistance 3
326032403220332033353350

STI Singapore - Weekly Summary and Economical Data

Weekly Wrap of STI Singapore:
It was a truncate week for Singapore equities and also with the Easter holiday STI flourished and gain made a high @3321 levels.

STI open flat @ 3268.13 levels and then it traded straight upward direction and on the last trading day of this week made a high @3321.62 and finally closed @ 3308.01 with gain of 49.44 points up by 1.59% wow basis.

Economic data:
  • Singapore's consumer price index rose a faster than expected 4.9 % in February from a year ago. Economists polled by Reuters were expecting an inflation rate of 4.1 % in February, up from 3.6 % in January.
  • Singapore on a year-on-year basis, manufacturing output contracted 16.6% in February 2013, partly attributed to lower activities over the Lunar New Year period. Excluding biomedical manufacturing, output fell 16.2%. On a three-month moving average basis, manufacturing output declined 4.9% in February 2013, compared to a year ago. On a seasonally adjusted month-on-month basis, manufacturing output declined 0.7% in February 2013 compared to January 2013. 
  • The general manufacturing cluster’s output contracted 11.5% in February 2013 on a year-on-year basis. The decline was registered across all segments as many firms shut down during the Lunar New Year period.  

Tuesday, March 26, 2013

Singapore Stock Market Forecast 27-March 2013

Market Review:
Singapore shares open lower today, but recover very well and closed above the resistance level with gain.

STI opens @ 3266.47 and then it traded higher side and made day high @ 3288.53 and then closed @ day high with gain of 21.05 @ 3288.53. Some 3.69 billion shares, valued at S$1.33 billion were traded. Gainers outnumbered losers 220 to 212.

Singapore on a year-on-year basis, manufacturing output contracted 16.6% in February 2013, partly attributed to lower activities over the Lunar New Year period. Excluding biomedical manufacturing, output fell 16.2%. On a three-month moving average basis, manufacturing output declined 4.9% in February 2013, compared to a year ago.On a seasonally adjusted month-on-month basis, manufacturing output declined 0.7% in February 2013 compared to January 2013. 

The general manufacturing cluster’s output contracted 11.5% in February 2013 on a year-on-year basis. The decline was registered across all segments as many firms shut down during the Lunar New Year period.  

Market forecast:
Today STI recovers from the previous session and closed @day high of @3288.53 above the resistnace level of 3285.

With the recovery from bottom level, STI formed a candlestick pattern called “White Marubozu” it is a single candlestick pattern characterized with a long white body having no shadows on either end. It is an extremely strong bullish candlestick pattern.

White Marubozu simply means that the opening price is equal to the low price of the day and the closing price is equal to the high price of the day. This shows that the buyers controlled the price action from the first trade to the last trade.

Support:
STI having immediate support @ 3260 level and below this level it can take support @3240-3220 will be the support zone for STI.


Resistance:
STI having immediate Resistance @3300 and above this level it may take resistance @ 3320-3335 levels.

Technical indicators:
Technical indicators MACD, RSI and CCI all are in recovering with today’s move. 

Monday, March 25, 2013

Singapore Stock Market Forecast for 26 March


Singapore shares rose on Monday after Cyprus and the European Union agreed to a plan to resolve the island's financial crisis.

STI opens @ 3264.69 and then it traded higher side and made day high @ 3278.380 and then closed with lose some points @ 3267.48 with gain of 8.91 points up by 0.27%.Some 5.21 billion shares, valued at S$1.29 billion were traded. Gainers outnumbered losers 288 to 153.

Singapore's consumer price index rose a faster than expected 4.9 % in February from a year ago. Economists polled by Reuters were expecting an inflation rate of 4.1 % in February, up from 3.6 % in January.


Market Forecast:
Today STI recovers from the previous session and closed higher @ 3267.48, STI made day high above 3275 levels but cant able to maintain this level.

With the recovery from bottom level, STI formed a candlestick pattern called “Shooting Star” The Shooting formation is created when the open, low, and close are roughly the same price. Also, there is a long upper shadow, generally defined as at least twice the length of the real body.

Again STI trading between the slopping lines, and now it is having support @ 3240-3220 levels and for higher levels it’s necessary for STI to maintain itself above 3320 mark.

Support:
STI having immediate support @ 3250 level and below this level it can take support @3220-3190 will be the support zone for STI.

Resistance:
STI having immediate Resistance @3285 and above this level it may take resistance @ 3300-3320 levels.

Technical indicators:
Technical indicators MACD, RSI and CCI all are in recovering with today’s move.

Support 1Support 2Support 3Resistance 1Resistance 2Resistance 3
325032203190328533003320

Friday, March 22, 2013

Straits Times Index - Weekly Outlook for Next Week 25-29 March

Market Forecast for week ahead: 
It’s a 2nd week where STI closed lower and currently traded @ lower level , took support for week @ 3248 level as previous, if crossed this level then it will be more bearish.

STI formed a candlestick pattern called “High Wave” is a type of candlestick characterized with either a very long upper or a lower shadow. It has only a short real body. A group of these patterns may signal a market turn. As STI took support @ 3248 levels so it may be turn from here but also on the other side if it will cross below this so bears will take charge.

STI trading in a down slopping channel and trading towards lowers level, also having strong support @ 3240-3220 levels if cross this level then it will move towards down side. On the other side for upward direction it would trade above 3320 mark.

STI Resistance:
 STI having Resistance @ 3300 and above this level it may take resistance from 3320-3335 levels.

STI Support:
STI having nearest support @ 3240 below this 3220-3190 will be the support area for market.

Technical Indicators:
Technical indicators are giving bearish impression.MACD seems to give bearish crossover.RSI trading above its centreline @ 62.487 and CCI also turning down and trading at 58.432.
Support 1Support 2Support 3Resistance 1Resistance 2Resistance 3
32403220319033033203335

STI Singapore Weekly Summary

Weekly wrap of STI: 
STI start with gap down and also closed at lower side, overall market was concern about bailout plan for Cyprus.

STI opens with gap @ 3261.16 and then traded higher and made week high @ 3283.70 but again faced resistance at this level and fell below its 3250 mark and took support at week low @ 3248.87 marks and finally closed @3258.57 with loss of 27.48 points down by 0.83% wow basis.

Economic data:
Consumer price inflation this year remained unchanged from the November survey, at 3.8%. But MAS core inflation, which strips out private transport and accommodation prices, is expected to come in at 2 %, down from the last survey's 2.2 % median forecast 

STI Index Flat; CapitaLand Jumps to 1-Week High


Singapore shares were little changed, as investors were concerned about a possible debt default by Cyprus and deteriorating economic activity in the euro zone.
Both the Straits Times Index and the MSCI index of Asia-Pacific shares outside Japan were flat.
Property developer CapitaLand Ltd outperformed the market and is the most actively traded stock by value on Friday. Shares jumped as much as 2 percent to a one-week high of S$3.57.
"Based on buyers' response to the new launches in March so far, it appears the latest measures have yet to dampen buyers' interest in the pre-sale market," Nomura said in a report.
However, Nomura warned investors that it is not a time to be complacent.
"There is scope for more policy changes, given the pre-sale market is still relatively robust," Nomura said. "We expect secondary transaction volume to remain relatively low."
Its top pick among the developers is CapitaMalls Asia Ltd , while it remain cautious on City Developments Ltd .

Thursday, March 21, 2013

Singapore Stock Market Outlook for 22-March 2013

Market Review: 
Singapore stocks recovered on Thursday helped by a pick-up in Chinese factory activity and a commitment by the U.S. Federal Reserve to its aggressive stimulus stance, but others ended weaker weighed down by a Cyprus bailout plan. Singapore recovering from the previous session's two week closing low.

STI opens @ 3248.93 and then recovers from that lower level, made day high @ 3274.55, after making high it loose almost 10 points and closed @ 3267.65 levels with gain of 19.25 points up by 0.59%.

Some 3.72 billion shares, valued at S$1.34 billion were traded. Gainers outnumbered losers 265 to 159.

Market forecast:
Today STI recovers from the previous session's 2 week closing low. STI yesterday made low of 3248.40 and today also it opens @ this level and recovers from that low mark.

With the recovery from bottom level, STI formed a candlestick pattern called “Tweezers Bottom” occurs during a downtrend when bears continue to take prices lower, usually closing the day near the lows (a bearish sign). Nevertheless, Day 2 is completely opposite because prices open and go nowhere but upwards. This bullish advance on Day 2 sometimes eliminates all losses from the previous day.

Again STI trading between the slopping lines, and now it is having support @ 3240-3220 levels and for higher levels it’s necessary for STI to maintain itself above 3320 mark.

Support:
STI having immediate support @ 3250 level and below this level it can take support @3220-3190 will be the support zone for STI.

Resistance:
STI having immediate Resistance @3285 and above this level it may take resistance @ 3300-3320 levels.

Technical indicators:
Technical indicators MACD, RSI and CCI all are in recovering with today’s move.

Support 1Support 2Support 3Resistance 1Resistance 2Resistance 3
325032203190328533003320

Singapore Stock Index Rises - SingTel Leads gainers

Singapore shares rose on Thursday, with Southeast Asia's largest telecom operator Singapore Telecommunications Ltd (SingTel) outperforming the market.
The Straits Times index was up 0.7 percent at 3,270.54, while MSCI's broadest index of Asia-Pacific shares outside Japan was 0.1 percent higher.
SingTel shares jumped as much as 3.2 percent to S$3.59 after two straight sessions of losses. It is the most actively traded stock by value in the Singapore market on Thursday, with 17.1 million shares changing hands.
"Shareholders are looking at cash returns from a possible divestment of Optus Satellite by SingTel," said Carey Wong, an analyst at OCBC Investment Research. "After the realignment of priorities, SingTel is moving from a pure carrier to providing more value-added services."
Overseas Union Enterprise Ltd (OUE) gained 1 percent to a 1-1/2-month high of S$3.03.
On Wednesday, sources told Reuters that the property developer has picked Credit Suisse, Goldman Sachs and Standard Chartered Plc for its planned S$1 billion ($800 million) listing of a hospitality real estate investment trust (REIT) in the second half of the year.
OUE confirmed on Thursday that the company is in "preliminary discussions" with banks. The properties to be injected in the REIT, the pipeline assets of the REIT, size of the offering and timeframe are under review, OUE added.

Wednesday, March 20, 2013

Singapore Stock Market Forecast for 21-March 2013

Market Reviews:
Asian markets were mixed on Wednesday after Cypriot lawmakers comprehensively rejected a plan to tax savings as part of a crucial

STI opens with gap @ 3255.79 and after that recovers some point and made day high @ 3265.85 and then again fell down and crossed 3250 levels and made day low @ 3248.40 and closed @ this level with loss of 20.73 points down by 0.63%.Some 3.2 billion shares, valued at S$1.31 billion were traded. Gainers outnumbered losers 254 to 186.

The outlook for headline consumer price inflation this year remained unchanged from the November survey, at 3.8%. But MAS core inflation, which strips out private transport and accommodation prices, is expected to come in at 2 %, down from the last survey's 2.2 % median forecast 

STI Singapore Technical Chart
STI Singapore Technical Chart - Intraday
Market forecast:
STI breached its support of 3250 and closed below this level @ 3248 mark, which is a bearish sign. As previously it took support @3250.

Today again STI opens with gap and formed a candlestick as previous day only difference is color  STI took support @ 3248 levels, previously also it took support at the same level and reverse, but if it will cross this level then its next support comes @ 3220 level.

Again STI trading between the slopping lines, and now it is having support @ 3240-3220 levels and for higher levels it’s necessary for STI to maintain itself above 3320 mark.

Support:
STI having immediate support @ 3240 level and below this level it can take support @3220-3190 will be the support zone for STI.

Resistance:
STI having immediate Resistance @3265 and above this level it may take resistance @ 3285-3300 levels.

Technical indicators:
Technical indicators MACD, RSI and CCI all are in bearish mode with today’s move.

Support 1Support 2Support 3Resistance 1Resistance 2Resistance 3
324032203190326532853300

Tuesday, March 19, 2013

STI Singapore Market Outlook for 20 March 2013

Market Review
After yesterdays 2 week lower level today STI opens higher and traded above the 3250 mark. Asian markets mostly rebounded on today.

STI opens higher @ 3263.18 levels and then also it were the day low point and STI recovers from this level and traded above 3265 mark and made day high @ 3283.70 and finally closed @ 3271.55 with gain of 12.66 points up by 0.39%.

Some 2.82 billion shares, valued at S$1.25 billion were traded. Gainers outnumbered losers 254 to 169.

Market forecast:
STI rebound from its 2 week lower level and traded above the last day closing, today closed with 12.66 point high above 3270 mark.

Today STI fill the gap of yesterday Falling window but closed below that gap , for the next up move STI have to maintain above 3320 levels and STI having good support @ 3220 mark.

Again STI trading between the slopping lines, and now it is having support @ 3260-3240 levels and for higher levels it’s necessary for STI to maintain itself above 3320 mark.

Support:
STI having immediate support @ 3260 level and below this level it can take support @3240-3220 will be the support zone for STI.

Resistance:
STI having immediate Resistance @3285 and above this level it may take resistance @ 3300-3320 levels.

Technical indicators:
Technical indicators MACD, RSI and CCI all are in recovery mode with today’s move.

Support 1Support 2Support 3Resistance 1Resistance 2Resistance 3
326032403220328533003320

Monday, March 18, 2013

Straits Times Index - Technical Outlook for 19 March

Market Review:
Singapore shares weaker on today, following Asian peers as nervous investors shifted to safer heavens after a radical bailout plan for Cyprus dented the appetite for risk assets globally.

STI opens with loss of 24.89 points @ 3261.16 and then it made day high @ 3269.33 and fell from that level, took support @ 3252.68 and finally closed @ 3256.47 with loss of 29.58 down by 0.90%.on a volume of 2.8 billion shares. There were 119 gainers against 270 losers by the close of dealings.

Singapore's non-oil domestic exports (NODX) fell 30.6 % year-on-year in February due to a contraction in both electronic and non-electronic exports, after climbing 0.4 % in January.

STI Technical Chart for Intraday
Market forecast:
STI cant able to sustains above 3300 mark longer and again fell below this @ 3300 and today closed @ 3256.47 levels.

STI formed a candlestick patter called “Falling Window” which reflects a bearish gap and thus serves as an area of resistance. Hence, one should look to sell if an index that gaps down approaches the fallen window, particularly if the rally is accompanied by below average volume.

Again STI trading between the slopping lines, and now it is having support @ 3250-3220 levels and for higher levels it’s necessary for STI to maintain itself above 3320 mark.

Support:
STI having immediate support @ 3250 level and below this level it can take support @3220-3190 will be the support zone for STI.

Resistance:
STI having immediate Resistance @3265 and above this level it may take resistance @ 3285-3300 levels.

Technical indicators:
Technical indicators MACD, RSI and CCI all are in recovery mode with today’s move. As we can see in the chart, RSI trading below its centreline @ 45.112 but CCI crossed its -100 level and closed @ 97.80 which is bearish signal.

Support 1Support 2Support 3Resistance 1Resistance 2Resistance 3
325032203190326532853300

Friday, March 15, 2013

Singapore Stock Market Forecast For Next Week 18-22 March


Market Forecast for week ahead:
  • If we see past few years chart then we find that from Nov 2010 to March 2013 STI crossed its 3300 mark thrice and every time it faced resistance near the 3320 mark.
  • STI formed a candlestick pattern called “Black Spinning Top” is a single candlestick pattern. Its shape is a small black body with upper and lower shadows having a greater  length than the body's length. If a Black Spinning Top is observed after a long rally or long white candlestick, this implies weakness among the bulls and it is a warning about a potential change or interruption in trend. This is applicable in case of STI.
  • For coming week STI looks neutral, whenever STI breached either side above 3320 and below 3220 the movement we will see the same.
STI Resistance:
  • STI having Resistance @ 3320 and above this level it may take resistance from 3335-3350 levels.
STI Support:
  • STI having nearest support @ 3265 below this 3240-3220 will be the support area for market.
Technical Indicators:
Technical indicators are giving missed impression.MACD seems to give bearish crossover.RSI trading above its centreline @ 67.66 and CCI near to its bullish zone @ 83.940


Support 1Support 2Support 3Resistance 1Resistance 2Resistance 3
326532403220332033353350

Tuesday, March 12, 2013

Straits Times Index - Intraday Outlook for 13 March

Market forecast:
STI closed its 5 week higher level above 3300 mark @ 3303.02, which is good for coming days as STI breach the resistance level.

Today STI cross its 3300 mark after struggling at this level and crossed resistance of 3315 level but cant able to cross the high.

STI formed a candlestick pattern called “shooting star” The Shooting Star simply tells us that the market opened near its low, then prices strongly rallied up and finally prices moved down to close near the opening price. In other words, the rally of the day was not sustained.

Support:
STI having immediate support @ 3280 level and below this level it can take support @3265-3250 will be the support zone for STI.

Resistance:
STI having immediate Resistance @3320 and above this level it may take resistance @ 3335-3350 levels.

Technical indicators:
Technical indicators MACD, RSI and CCI all are in recovery mode with today’s move. As we can see in the chart, RSI trading above its centreline @ 59.44 and CCI also crossed its +100 level and closed @ 115.420 which is bullish signal and MACD too about to give bullish crossover.

Support 1Support 2Support 3Resistance 1Resistance 2Resistance 3
328032653250332033353350

SingXpress Land Ltd. Jumps To Near 11 Month High


Shares of SingXpress Land Ltd jumped to a near 11-month high of S$0.022 after the property and financial services company announced plans to raise S$226.5 million ($181.30 million) for its venture into the U.S. property market.

The shares rose as much as 29.4 percent, with 281 million shares traded, 6.2 times the average full-day volume over the past 30 days.

SingXpress, which will be renamed SingHaiyi Group, will appoint Neil Bush, the brother of former U.S. president George W Bush, as chairman of the company.

"The appointment of Neil Bush is quite reassuring to the investors," a trader said, adding the announcement was a "game changer" for SingXpress.

 
Design by Free WordPress Themes | Bloggerized by Lasantha - Premium Blogger Themes | Grants For Single Moms